Zip Codes with the Highest Percentage of Population Employed in Health Diagnosing & Treating in Downers Grove, IL
RELATED REPORTS & OPTIONS
Health Diagnosing & Treating
Downers Grove
Compare Zip Codes
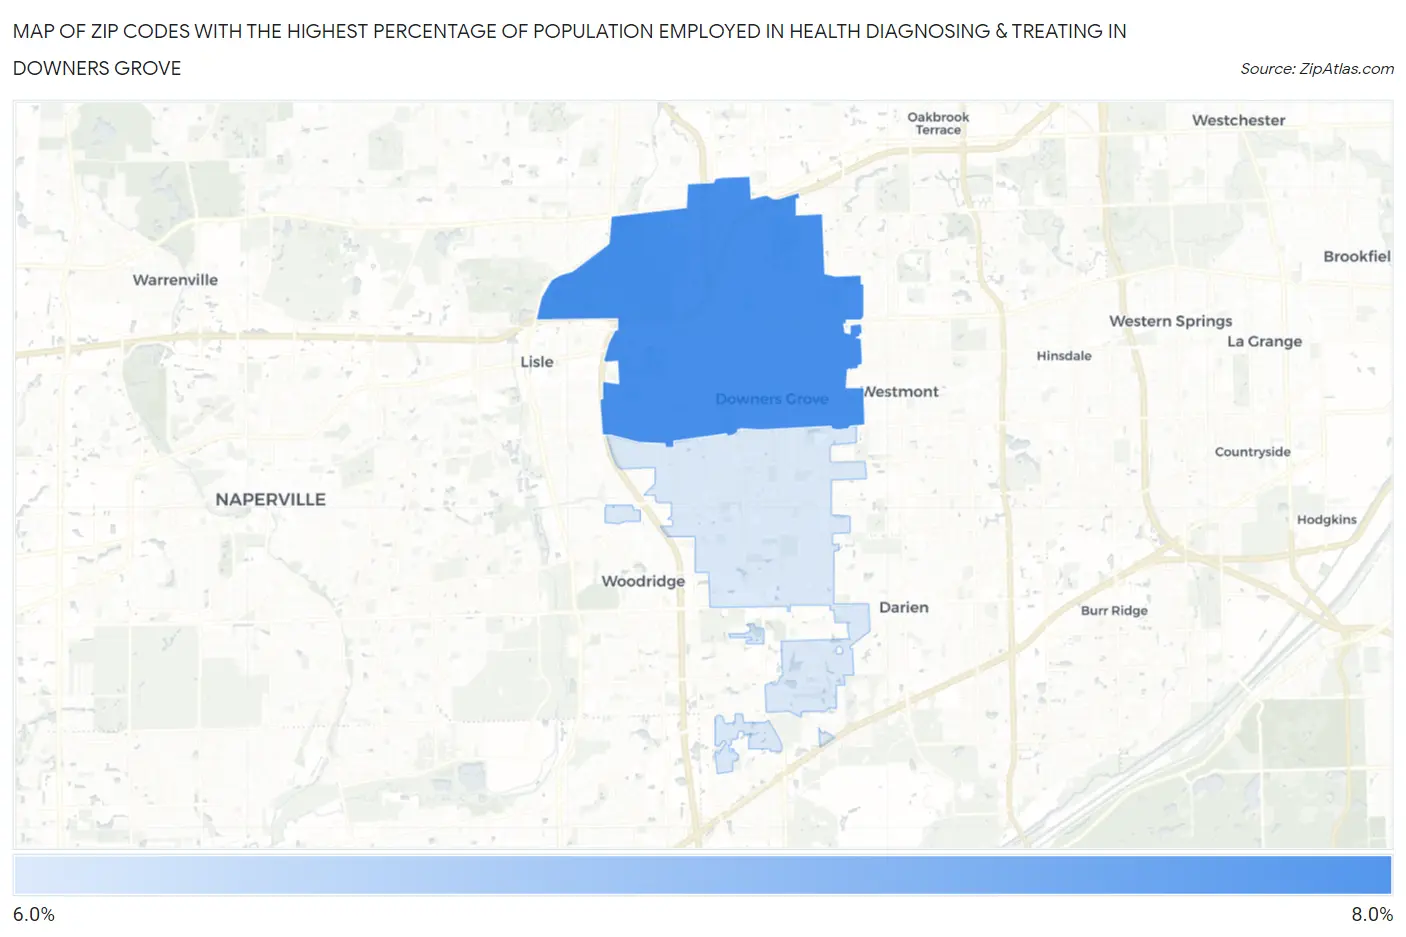
Map of Zip Codes with the Highest Percentage of Population Employed in Health Diagnosing & Treating in Downers Grove
6.3%
7.7%
Zip Codes with the Highest Percentage of Population Employed in Health Diagnosing & Treating in Downers Grove, IL
| Zip Code | % Employed | vs State | vs National | |
| 1. | 60515 | 7.7% | 6.2%(+1.47)#408 | 6.2%(+1.46)#8,228 |
| 2. | 60516 | 6.3% | 6.2%(+0.059)#591 | 6.2%(+0.050)#12,767 |
1
Common Questions
What are the Top Zip Codes with the Highest Percentage of Population Employed in Health Diagnosing & Treating in Downers Grove, IL?
Top Zip Codes with the Highest Percentage of Population Employed in Health Diagnosing & Treating in Downers Grove, IL are:
What zip code has the Highest Percentage of Population Employed in Health Diagnosing & Treating in Downers Grove, IL?
60515 has the Highest Percentage of Population Employed in Health Diagnosing & Treating in Downers Grove, IL with 7.7%.
What is the Percentage of Population Employed in Health Diagnosing & Treating in Downers Grove, IL?
Percentage of Population Employed in Health Diagnosing & Treating in Downers Grove is 7.4%.
What is the Percentage of Population Employed in Health Diagnosing & Treating in Illinois?
Percentage of Population Employed in Health Diagnosing & Treating in Illinois is 6.2%.
What is the Percentage of Population Employed in Health Diagnosing & Treating in the United States?
Percentage of Population Employed in Health Diagnosing & Treating in the United States is 6.2%.