Zip Codes with the Highest Percentage of Population Employed in Legal Services & Support in Arlington Heights, IL
RELATED REPORTS & OPTIONS
Legal Services & Support
Arlington Heights
Compare Zip Codes
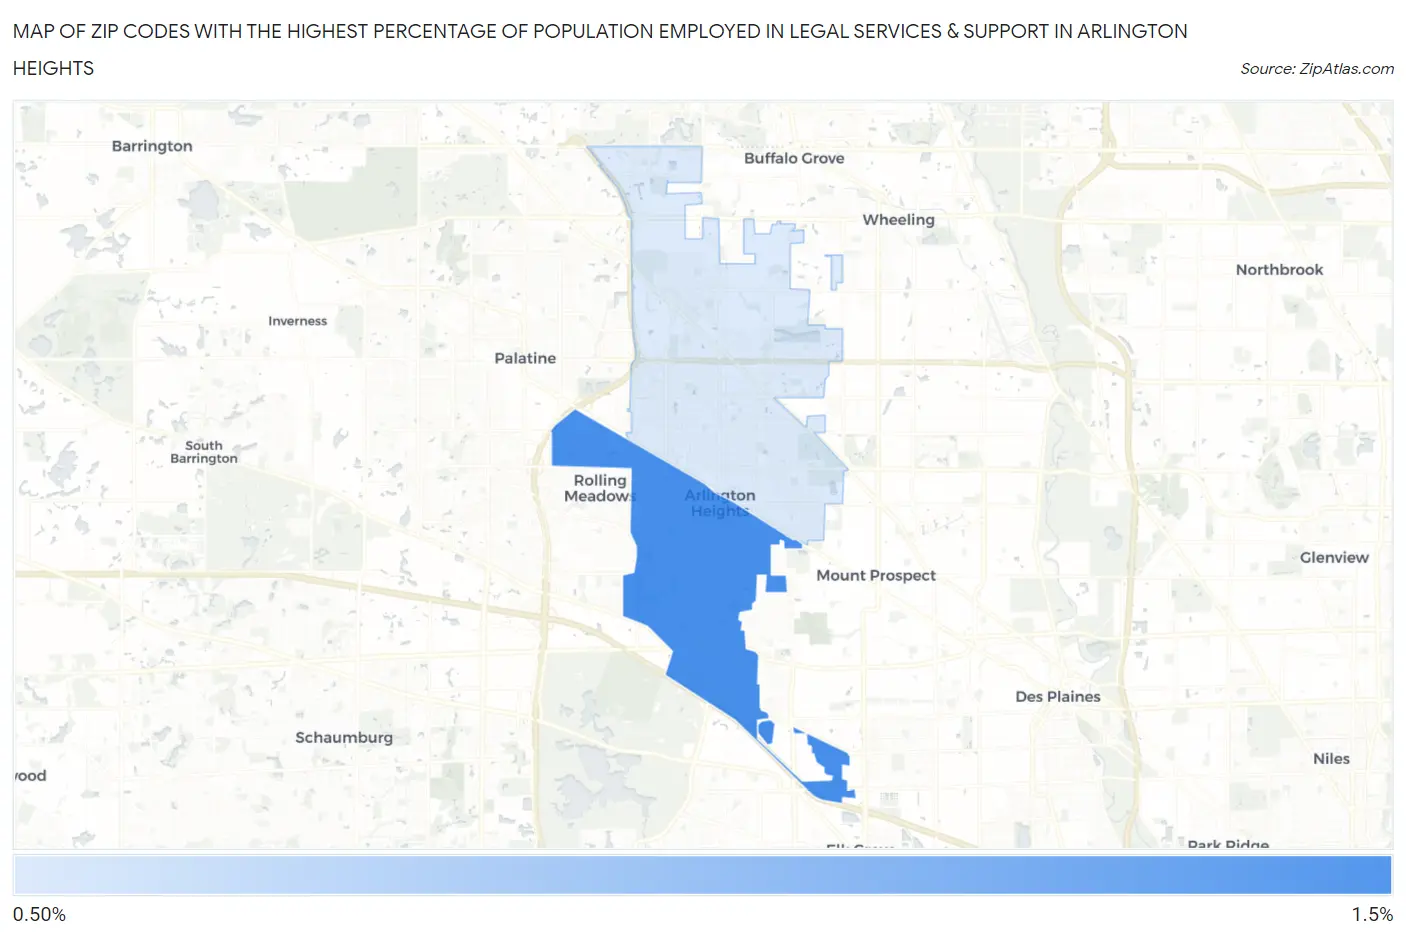
Map of Zip Codes with the Highest Percentage of Population Employed in Legal Services & Support in Arlington Heights
1.5%
1.5%
Zip Codes with the Highest Percentage of Population Employed in Legal Services & Support in Arlington Heights, IL
| Zip Code | % Employed | vs State | vs National | |
| 1. | 60005 | 1.5% | 1.3%(+0.148)#188 | 1.2%(+0.313)#5,064 |
| 2. | 60004 | 1.5% | 1.3%(+0.141)#189 | 1.2%(+0.307)#5,083 |
1
Common Questions
What are the Top Zip Codes with the Highest Percentage of Population Employed in Legal Services & Support in Arlington Heights, IL?
Top Zip Codes with the Highest Percentage of Population Employed in Legal Services & Support in Arlington Heights, IL are:
What zip code has the Highest Percentage of Population Employed in Legal Services & Support in Arlington Heights, IL?
60005 has the Highest Percentage of Population Employed in Legal Services & Support in Arlington Heights, IL with 1.5%.
What is the Percentage of Population Employed in Legal Services & Support in Arlington Heights, IL?
Percentage of Population Employed in Legal Services & Support in Arlington Heights is 1.6%.
What is the Percentage of Population Employed in Legal Services & Support in Illinois?
Percentage of Population Employed in Legal Services & Support in Illinois is 1.3%.
What is the Percentage of Population Employed in Legal Services & Support in the United States?
Percentage of Population Employed in Legal Services & Support in the United States is 1.2%.