Zip Codes with the Highest Percentage of Population with a Degree in Literature and Languages in New Mexico
RELATED REPORTS & OPTIONS
Literature and Languages
New Mexico
Compare Zip Codes
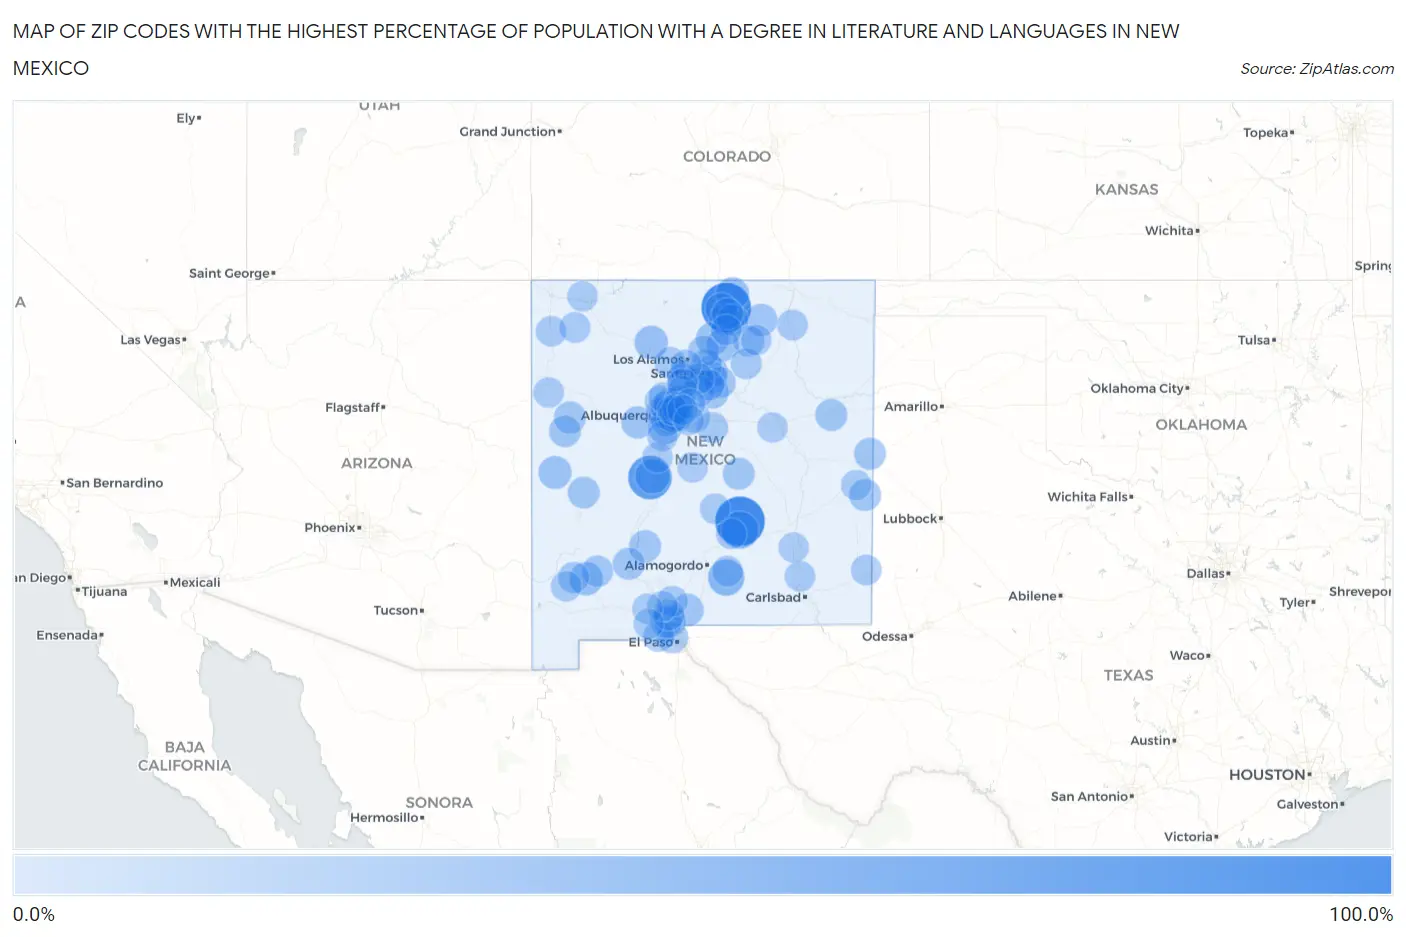
Map of Zip Codes with the Highest Percentage of Population with a Degree in Literature and Languages in New Mexico
0.0%
100.0%
Zip Codes with the Highest Percentage of Population with a Degree in Literature and Languages in New Mexico
| Zip Code | % Graduates | vs State | vs National | |
| 1. | 88338 | 100.0% | 5.1%(+94.9)#1 | 4.4%(+95.6)#6 |
| 2. | 87564 | 100.0% | 5.1%(+94.9)#2 | 4.4%(+95.6)#16 |
| 3. | 87823 | 70.0% | 5.1%(+64.9)#3 | 4.4%(+65.6)#33 |
| 4. | 88348 | 38.7% | 5.1%(+33.6)#4 | 4.4%(+34.3)#127 |
| 5. | 88347 | 33.3% | 5.1%(+28.2)#5 | 4.4%(+28.9)#172 |
| 6. | 87828 | 25.6% | 5.1%(+20.5)#6 | 4.4%(+21.2)#289 |
| 7. | 87022 | 19.8% | 5.1%(+14.7)#7 | 4.4%(+15.4)#490 |
| 8. | 87027 | 18.9% | 5.1%(+13.8)#8 | 4.4%(+14.5)#524 |
| 9. | 88023 | 18.3% | 5.1%(+13.2)#9 | 4.4%(+13.9)#558 |
| 10. | 87556 | 16.7% | 5.1%(+11.5)#10 | 4.4%(+12.3)#647 |
| 11. | 87829 | 16.2% | 5.1%(+11.0)#11 | 4.4%(+11.7)#704 |
| 12. | 87527 | 15.8% | 5.1%(+10.7)#12 | 4.4%(+11.4)#738 |
| 13. | 87521 | 14.8% | 5.1%(+9.65)#13 | 4.4%(+10.4)#839 |
| 14. | 88081 | 13.4% | 5.1%(+8.26)#14 | 4.4%(+8.98)#997 |
| 15. | 87714 | 12.7% | 5.1%(+7.59)#15 | 4.4%(+8.30)#1,096 |
| 16. | 87540 | 12.7% | 5.1%(+7.56)#16 | 4.4%(+8.28)#1,103 |
| 17. | 88024 | 12.7% | 5.1%(+7.56)#17 | 4.4%(+8.27)#1,106 |
| 18. | 87501 | 12.6% | 5.1%(+7.52)#18 | 4.4%(+8.24)#1,111 |
| 19. | 87026 | 12.2% | 5.1%(+7.10)#19 | 4.4%(+7.81)#1,189 |
| 20. | 87901 | 12.0% | 5.1%(+6.91)#20 | 4.4%(+7.62)#1,218 |
| 21. | 87529 | 11.6% | 5.1%(+6.43)#21 | 4.4%(+7.14)#1,320 |
| 22. | 87321 | 11.4% | 5.1%(+6.31)#22 | 4.4%(+7.02)#1,345 |
| 23. | 88401 | 11.4% | 5.1%(+6.27)#23 | 4.4%(+6.98)#1,364 |
| 24. | 87931 | 11.4% | 5.1%(+6.26)#24 | 4.4%(+6.97)#1,366 |
| 25. | 88132 | 11.1% | 5.1%(+5.99)#25 | 4.4%(+6.70)#1,443 |
| 26. | 88135 | 10.6% | 5.1%(+5.50)#26 | 4.4%(+6.22)#1,585 |
| 27. | 87821 | 10.6% | 5.1%(+5.49)#27 | 4.4%(+6.20)#1,594 |
| 28. | 87106 | 10.5% | 5.1%(+5.41)#28 | 4.4%(+6.12)#1,620 |
| 29. | 88318 | 10.5% | 5.1%(+5.41)#29 | 4.4%(+6.12)#1,628 |
| 30. | 87513 | 10.5% | 5.1%(+5.34)#30 | 4.4%(+6.06)#1,653 |
| 31. | 87505 | 10.4% | 5.1%(+5.30)#31 | 4.4%(+6.01)#1,666 |
| 32. | 87357 | 10.1% | 5.1%(+5.01)#32 | 4.4%(+5.72)#1,768 |
| 33. | 87104 | 9.4% | 5.1%(+4.26)#33 | 4.4%(+4.97)#2,098 |
| 34. | 88063 | 9.0% | 5.1%(+3.84)#34 | 4.4%(+4.55)#2,337 |
| 35. | 87571 | 8.9% | 5.1%(+3.83)#35 | 4.4%(+4.54)#2,346 |
| 36. | 87506 | 8.9% | 5.1%(+3.78)#36 | 4.4%(+4.49)#2,370 |
| 37. | 87535 | 8.5% | 5.1%(+3.37)#37 | 4.4%(+4.08)#2,619 |
| 38. | 88027 | 8.4% | 5.1%(+3.27)#38 | 4.4%(+3.98)#2,687 |
| 39. | 87108 | 8.4% | 5.1%(+3.26)#39 | 4.4%(+3.97)#2,694 |
| 40. | 88041 | 8.1% | 5.1%(+2.94)#40 | 4.4%(+3.65)#2,933 |
| 41. | 87010 | 7.9% | 5.1%(+2.81)#41 | 4.4%(+3.52)#3,045 |
| 42. | 87514 | 7.8% | 5.1%(+2.73)#42 | 4.4%(+3.44)#3,108 |
| 43. | 88008 | 7.8% | 5.1%(+2.63)#43 | 4.4%(+3.34)#3,199 |
| 44. | 87114 | 7.6% | 5.1%(+2.46)#44 | 4.4%(+3.17)#3,371 |
| 45. | 87083 | 7.5% | 5.1%(+2.39)#45 | 4.4%(+3.10)#3,426 |
| 46. | 88065 | 7.2% | 5.1%(+2.10)#46 | 4.4%(+2.81)#3,740 |
| 47. | 87107 | 7.1% | 5.1%(+1.98)#47 | 4.4%(+2.70)#3,862 |
| 48. | 87508 | 7.0% | 5.1%(+1.92)#48 | 4.4%(+2.63)#3,959 |
| 49. | 87110 | 7.0% | 5.1%(+1.87)#49 | 4.4%(+2.58)#4,007 |
| 50. | 87567 | 6.9% | 5.1%(+1.81)#50 | 4.4%(+2.52)#4,076 |
| 51. | 87722 | 6.9% | 5.1%(+1.76)#51 | 4.4%(+2.47)#4,130 |
| 52. | 87102 | 6.9% | 5.1%(+1.75)#52 | 4.4%(+2.46)#4,149 |
| 53. | 87025 | 6.6% | 5.1%(+1.52)#53 | 4.4%(+2.23)#4,444 |
| 54. | 88072 | 6.6% | 5.1%(+1.44)#54 | 4.4%(+2.15)#4,552 |
| 55. | 87745 | 6.5% | 5.1%(+1.39)#55 | 4.4%(+2.10)#4,628 |
| 56. | 87035 | 6.1% | 5.1%(+0.989)#56 | 4.4%(+1.70)#5,259 |
| 57. | 87747 | 5.9% | 5.1%(+0.762)#57 | 4.4%(+1.47)#5,625 |
| 58. | 87072 | 5.8% | 5.1%(+0.649)#58 | 4.4%(+1.36)#5,806 |
| 59. | 88317 | 5.6% | 5.1%(+0.472)#59 | 4.4%(+1.18)#6,143 |
| 60. | 87120 | 5.6% | 5.1%(+0.451)#60 | 4.4%(+1.16)#6,184 |
| 61. | 87507 | 5.5% | 5.1%(+0.381)#61 | 4.4%(+1.09)#6,313 |
| 62. | 87112 | 5.3% | 5.1%(+0.205)#62 | 4.4%(+0.916)#6,669 |
| 63. | 87499 | 5.2% | 5.1%(+0.074)#63 | 4.4%(+0.785)#6,956 |
| 64. | 87105 | 5.2% | 5.1%(+0.054)#64 | 4.4%(+0.765)#7,002 |
| 65. | 87124 | 5.1% | 5.1%(-0.048)#65 | 4.4%(+0.663)#7,178 |
| 66. | 87048 | 5.0% | 5.1%(-0.087)#66 | 4.4%(+0.624)#7,276 |
| 67. | 87544 | 4.9% | 5.1%(-0.231)#67 | 4.4%(+0.479)#7,649 |
| 68. | 87015 | 4.9% | 5.1%(-0.238)#68 | 4.4%(+0.473)#7,665 |
| 69. | 87455 | 4.8% | 5.1%(-0.359)#69 | 4.4%(+0.352)#8,006 |
| 70. | 88011 | 4.7% | 5.1%(-0.434)#70 | 4.4%(+0.276)#8,198 |
| 71. | 88210 | 4.6% | 5.1%(-0.516)#71 | 4.4%(+0.195)#8,414 |
| 72. | 88346 | 4.6% | 5.1%(-0.529)#72 | 4.4%(+0.182)#8,460 |
| 73. | 87557 | 4.5% | 5.1%(-0.572)#73 | 4.4%(+0.139)#8,575 |
| 74. | 88061 | 4.5% | 5.1%(-0.595)#74 | 4.4%(+0.116)#8,652 |
| 75. | 87144 | 4.5% | 5.1%(-0.659)#75 | 4.4%(+0.052)#8,823 |
| 76. | 88242 | 4.4% | 5.1%(-0.732)#76 | 4.4%(-0.022)#9,028 |
| 77. | 87043 | 4.4% | 5.1%(-0.760)#77 | 4.4%(-0.049)#9,114 |
| 78. | 88001 | 4.3% | 5.1%(-0.832)#78 | 4.4%(-0.122)#9,342 |
| 79. | 87123 | 4.2% | 5.1%(-0.875)#79 | 4.4%(-0.164)#9,474 |
| 80. | 88005 | 4.2% | 5.1%(-0.885)#80 | 4.4%(-0.174)#9,497 |
| 81. | 87001 | 4.2% | 5.1%(-0.886)#81 | 4.4%(-0.175)#9,501 |
| 82. | 87052 | 4.2% | 5.1%(-0.954)#82 | 4.4%(-0.243)#9,708 |
| 83. | 87305 | 4.2% | 5.1%(-0.954)#83 | 4.4%(-0.243)#9,710 |
| 84. | 87734 | 4.2% | 5.1%(-0.954)#84 | 4.4%(-0.243)#9,722 |
| 85. | 87401 | 4.2% | 5.1%(-0.961)#85 | 4.4%(-0.250)#9,739 |
| 86. | 87116 | 4.0% | 5.1%(-1.12)#86 | 4.4%(-0.410)#10,167 |
| 87. | 87006 | 4.0% | 5.1%(-1.15)#87 | 4.4%(-0.436)#10,252 |
| 88. | 88301 | 4.0% | 5.1%(-1.16)#88 | 4.4%(-0.449)#10,298 |
| 89. | 87111 | 3.9% | 5.1%(-1.19)#89 | 4.4%(-0.479)#10,385 |
| 90. | 87122 | 3.9% | 5.1%(-1.20)#90 | 4.4%(-0.488)#10,425 |
| 91. | 87031 | 3.9% | 5.1%(-1.25)#91 | 4.4%(-0.539)#10,591 |
| 92. | 87109 | 3.8% | 5.1%(-1.30)#92 | 4.4%(-0.586)#10,744 |
| 93. | 87047 | 3.8% | 5.1%(-1.30)#93 | 4.4%(-0.591)#10,753 |
| 94. | 88044 | 3.6% | 5.1%(-1.50)#94 | 4.4%(-0.791)#11,432 |
| 95. | 87008 | 3.4% | 5.1%(-1.71)#95 | 4.4%(-1.00)#12,160 |
| 96. | 88203 | 3.3% | 5.1%(-1.77)#96 | 4.4%(-1.06)#12,357 |
| 97. | 87059 | 3.3% | 5.1%(-1.87)#97 | 4.4%(-1.15)#12,701 |
| 98. | 88130 | 3.2% | 5.1%(-1.90)#98 | 4.4%(-1.19)#12,825 |
| 99. | 87036 | 3.2% | 5.1%(-1.93)#99 | 4.4%(-1.22)#12,954 |
| 100. | 88435 | 3.2% | 5.1%(-1.94)#100 | 4.4%(-1.23)#12,980 |
Common Questions
What are the Top 10 Zip Codes with the Highest Percentage of Population with a Degree in Literature and Languages in New Mexico?
Top 10 Zip Codes with the Highest Percentage of Population with a Degree in Literature and Languages in New Mexico are:
What zip code has the Highest Percentage of Population with a Degree in Literature and Languages in New Mexico?
88338 has the Highest Percentage of Population with a Degree in Literature and Languages in New Mexico with 100.0%.
What is the Percentage of Population with a Degree in Literature and Languages in the State of New Mexico?
Percentage of Population with a Degree in Literature and Languages in New Mexico is 5.1%.
What is the Percentage of Population with a Degree in Literature and Languages in the United States?
Percentage of Population with a Degree in Literature and Languages in the United States is 4.4%.