Zip Codes with the Highest Percentage of Population with a Degree in Literature and Languages in District Of Columbia
RELATED REPORTS & OPTIONS
Literature and Languages
District Of Columbia
Compare Zip Codes
Map of Zip Codes with the Highest Percentage of Population with a Degree in Literature and Languages in District Of Columbia
0.0%
50.0%
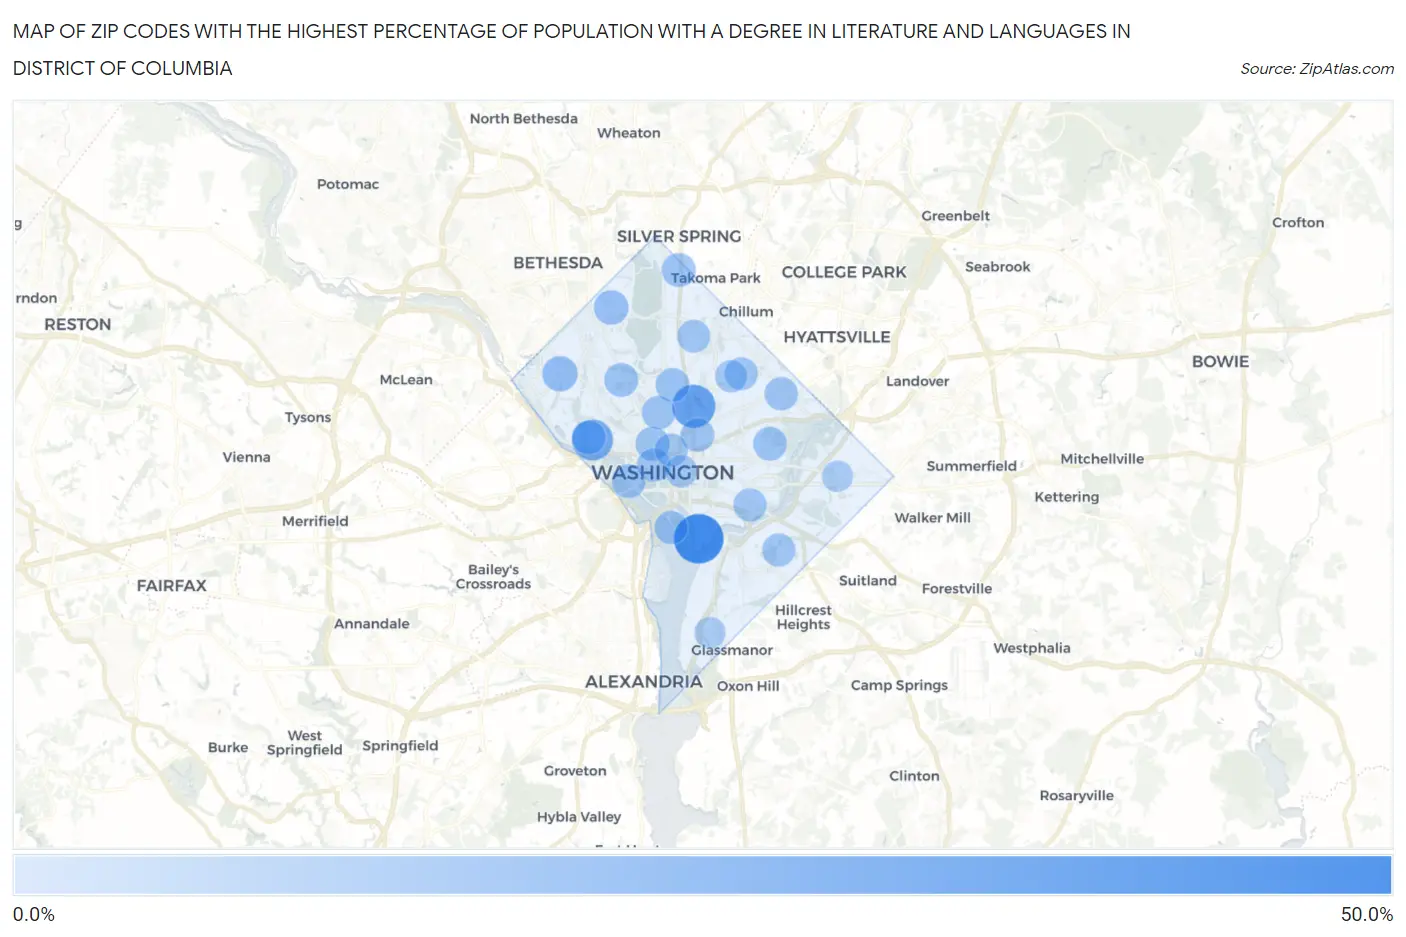
Zip Codes with the Highest Percentage of Population with a Degree in Literature and Languages in District Of Columbia
| Zip Code | % Graduates | vs State | vs National | |
| 1. | 20319 | 50.0% | 8.1%(+41.9)#1 | 4.4%(+45.6)#78 |
| 2. | 20059 | 33.3% | 8.1%(+25.2)#2 | 4.4%(+28.9)#155 |
| 3. | 20057 | 27.3% | 8.1%(+19.1)#3 | 4.4%(+22.9)#248 |
| 4. | 20016 | 12.6% | 8.1%(+4.50)#4 | 4.4%(+8.24)#1,110 |
| 5. | 20015 | 10.7% | 8.1%(+2.57)#5 | 4.4%(+6.31)#1,550 |
| 6. | 20012 | 9.2% | 8.1%(+1.03)#6 | 4.4%(+4.77)#2,222 |
| 7. | 20036 | 9.1% | 8.1%(+0.972)#7 | 4.4%(+4.71)#2,250 |
| 8. | 20007 | 9.1% | 8.1%(+0.964)#8 | 4.4%(+4.70)#2,253 |
| 9. | 20008 | 9.0% | 8.1%(+0.850)#9 | 4.4%(+4.59)#2,318 |
| 10. | 20037 | 9.0% | 8.1%(+0.838)#10 | 4.4%(+4.58)#2,327 |
| 11. | 20010 | 8.8% | 8.1%(+0.615)#11 | 4.4%(+4.35)#2,437 |
| 12. | 20002 | 8.6% | 8.1%(+0.447)#12 | 4.4%(+4.19)#2,548 |
| 13. | 20001 | 8.3% | 8.1%(+0.138)#13 | 4.4%(+3.88)#2,756 |
| 14. | 20009 | 8.2% | 8.1%(+0.036)#14 | 4.4%(+3.77)#2,833 |
| 15. | 20006 | 8.1% | 8.1%(-0.092)#15 | 4.4%(+3.65)#2,938 |
| 16. | 20018 | 7.7% | 8.1%(-0.496)#16 | 4.4%(+3.24)#3,302 |
| 17. | 20024 | 7.5% | 8.1%(-0.639)#17 | 4.4%(+3.10)#3,429 |
| 18. | 20020 | 7.2% | 8.1%(-0.956)#18 | 4.4%(+2.78)#3,767 |
| 19. | 20003 | 7.1% | 8.1%(-1.02)#19 | 4.4%(+2.72)#3,838 |
| 20. | 20005 | 7.1% | 8.1%(-1.07)#20 | 4.4%(+2.67)#3,898 |
| 21. | 20011 | 6.8% | 8.1%(-1.36)#21 | 4.4%(+2.38)#4,254 |
| 22. | 20017 | 6.8% | 8.1%(-1.40)#22 | 4.4%(+2.34)#4,299 |
| 23. | 20064 | 5.2% | 8.1%(-2.94)#23 | 4.4%(+0.799)#6,927 |
| 24. | 20004 | 4.8% | 8.1%(-3.40)#24 | 4.4%(+0.342)#8,044 |
| 25. | 20019 | 2.2% | 8.1%(-5.99)#25 | 4.4%(-2.25)#16,547 |
| 26. | 20032 | 2.0% | 8.1%(-6.17)#26 | 4.4%(-2.43)#17,151 |
1
Common Questions
What are the Top 10 Zip Codes with the Highest Percentage of Population with a Degree in Literature and Languages in District Of Columbia?
Top 10 Zip Codes with the Highest Percentage of Population with a Degree in Literature and Languages in District Of Columbia are:
What zip code has the Highest Percentage of Population with a Degree in Literature and Languages in District Of Columbia?
20319 has the Highest Percentage of Population with a Degree in Literature and Languages in District Of Columbia with 50.0%.
What is the Percentage of Population with a Degree in Literature and Languages in the State of District Of Columbia?
Percentage of Population with a Degree in Literature and Languages in District Of Columbia is 8.1%.
What is the Percentage of Population with a Degree in Literature and Languages in the United States?
Percentage of Population with a Degree in Literature and Languages in the United States is 4.4%.