Zip Codes with the Highest Percentage of Population with a Degree in Literature and Languages in Nevada
RELATED REPORTS & OPTIONS
Literature and Languages
Nevada
Compare Zip Codes
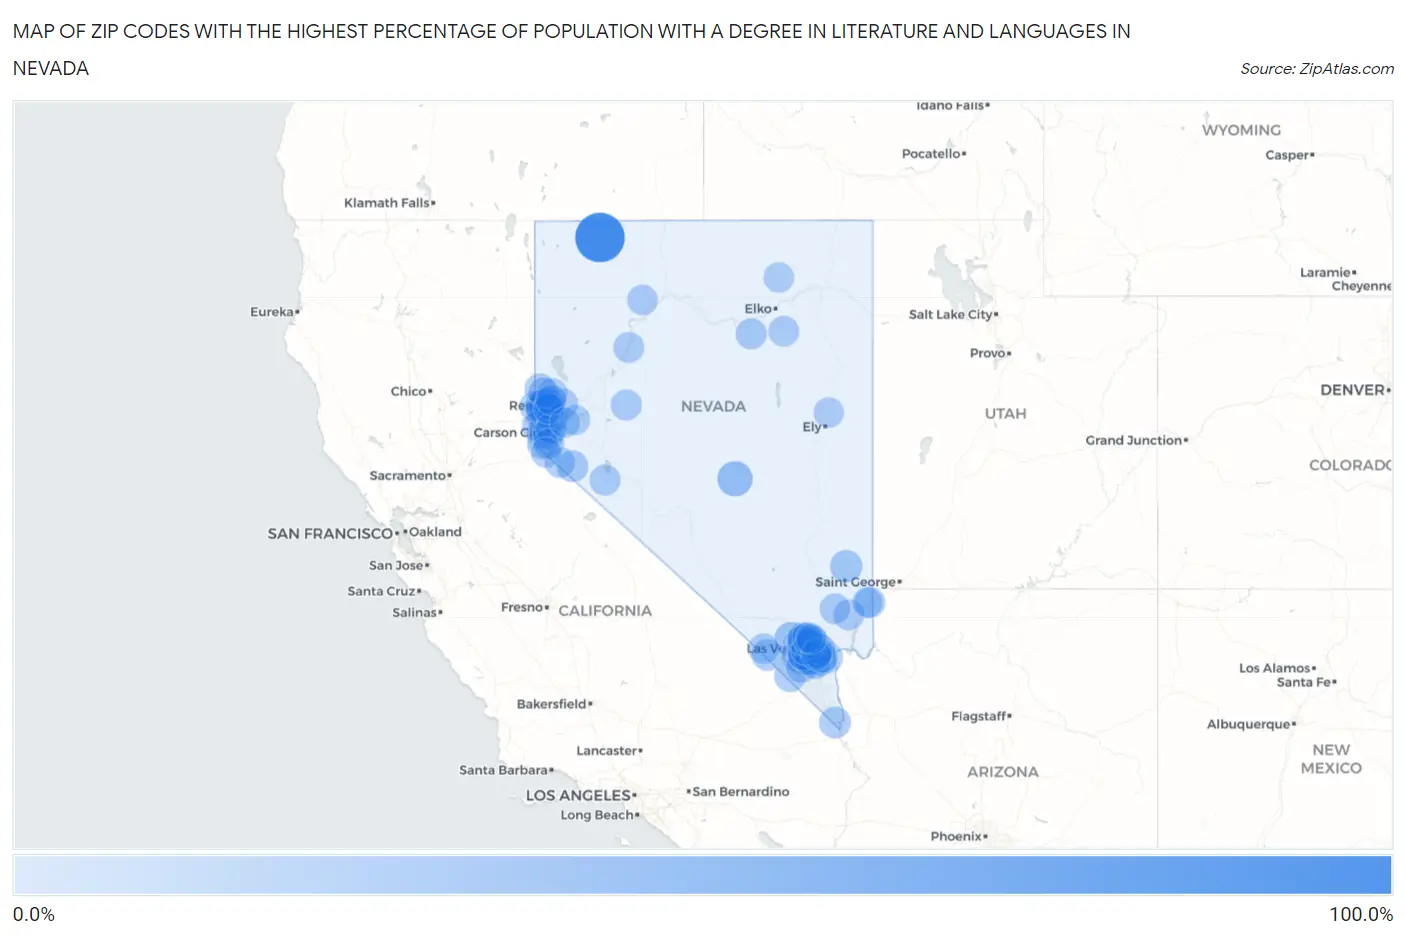
Map of Zip Codes with the Highest Percentage of Population with a Degree in Literature and Languages in Nevada
0.0%
100.0%
Zip Codes with the Highest Percentage of Population with a Degree in Literature and Languages in Nevada
| Zip Code | % Graduates | vs State | vs National | |
| 1. | 89404 | 100.0% | 3.5%(+96.5)#1 | 4.4%(+95.6)#22 |
| 2. | 89049 | 25.2% | 3.5%(+21.7)#2 | 4.4%(+20.8)#299 |
| 3. | 89124 | 16.9% | 3.5%(+13.4)#3 | 4.4%(+12.5)#641 |
| 4. | 89008 | 11.0% | 3.5%(+7.57)#4 | 4.4%(+6.62)#1,465 |
| 5. | 89704 | 9.5% | 3.5%(+6.07)#5 | 4.4%(+5.12)#2,021 |
| 6. | 89061 | 7.8% | 3.5%(+4.32)#6 | 4.4%(+3.37)#3,175 |
| 7. | 89509 | 7.5% | 3.5%(+4.02)#7 | 4.4%(+3.07)#3,461 |
| 8. | 89444 | 7.4% | 3.5%(+3.96)#8 | 4.4%(+3.02)#3,521 |
| 9. | 89029 | 7.3% | 3.5%(+3.84)#9 | 4.4%(+2.90)#3,651 |
| 10. | 89019 | 7.0% | 3.5%(+3.49)#10 | 4.4%(+2.54)#4,051 |
| 11. | 89138 | 6.6% | 3.5%(+3.16)#11 | 4.4%(+2.22)#4,459 |
| 12. | 89074 | 5.4% | 3.5%(+1.91)#12 | 4.4%(+0.963)#6,571 |
| 13. | 89501 | 5.3% | 3.5%(+1.84)#13 | 4.4%(+0.898)#6,708 |
| 14. | 89512 | 5.2% | 3.5%(+1.72)#14 | 4.4%(+0.780)#6,970 |
| 15. | 89703 | 5.0% | 3.5%(+1.57)#15 | 4.4%(+0.622)#7,281 |
| 16. | 89123 | 5.0% | 3.5%(+1.49)#16 | 4.4%(+0.545)#7,473 |
| 17. | 89102 | 5.0% | 3.5%(+1.49)#17 | 4.4%(+0.544)#7,476 |
| 18. | 89110 | 4.9% | 3.5%(+1.47)#18 | 4.4%(+0.524)#7,522 |
| 19. | 89822 | 4.8% | 3.5%(+1.32)#19 | 4.4%(+0.375)#7,936 |
| 20. | 89503 | 4.7% | 3.5%(+1.22)#20 | 4.4%(+0.274)#8,202 |
| 21. | 89511 | 4.5% | 3.5%(+1.05)#21 | 4.4%(+0.111)#8,664 |
| 22. | 89144 | 4.5% | 3.5%(+1.03)#22 | 4.4%(+0.082)#8,738 |
| 23. | 89120 | 4.4% | 3.5%(+0.958)#23 | 4.4%(+0.014)#8,931 |
| 24. | 89519 | 4.4% | 3.5%(+0.951)#24 | 4.4%(+0.007)#8,952 |
| 25. | 89101 | 4.4% | 3.5%(+0.930)#25 | 4.4%(-0.014)#9,005 |
| 26. | 89415 | 4.3% | 3.5%(+0.861)#26 | 4.4%(-0.083)#9,216 |
| 27. | 89701 | 4.3% | 3.5%(+0.825)#27 | 4.4%(-0.119)#9,334 |
| 28. | 89107 | 4.3% | 3.5%(+0.821)#28 | 4.4%(-0.123)#9,349 |
| 29. | 89005 | 4.2% | 3.5%(+0.761)#29 | 4.4%(-0.183)#9,525 |
| 30. | 89130 | 4.2% | 3.5%(+0.741)#30 | 4.4%(-0.203)#9,583 |
| 31. | 89052 | 4.2% | 3.5%(+0.713)#31 | 4.4%(-0.231)#9,668 |
| 32. | 89134 | 4.2% | 3.5%(+0.711)#32 | 4.4%(-0.233)#9,676 |
| 33. | 89439 | 4.2% | 3.5%(+0.709)#33 | 4.4%(-0.235)#9,683 |
| 34. | 89004 | 4.2% | 3.5%(+0.701)#34 | 4.4%(-0.243)#9,723 |
| 35. | 89434 | 4.1% | 3.5%(+0.661)#35 | 4.4%(-0.283)#9,830 |
| 36. | 89119 | 4.1% | 3.5%(+0.644)#36 | 4.4%(-0.300)#9,880 |
| 37. | 89523 | 4.0% | 3.5%(+0.538)#37 | 4.4%(-0.406)#10,161 |
| 38. | 89121 | 4.0% | 3.5%(+0.530)#38 | 4.4%(-0.414)#10,190 |
| 39. | 89117 | 4.0% | 3.5%(+0.508)#39 | 4.4%(-0.436)#10,253 |
| 40. | 89128 | 3.8% | 3.5%(+0.337)#40 | 4.4%(-0.607)#10,813 |
| 41. | 89135 | 3.8% | 3.5%(+0.322)#41 | 4.4%(-0.622)#10,864 |
| 42. | 89141 | 3.7% | 3.5%(+0.279)#42 | 4.4%(-0.665)#11,002 |
| 43. | 89118 | 3.7% | 3.5%(+0.246)#43 | 4.4%(-0.698)#11,115 |
| 44. | 89129 | 3.7% | 3.5%(+0.223)#44 | 4.4%(-0.721)#11,197 |
| 45. | 89169 | 3.7% | 3.5%(+0.221)#45 | 4.4%(-0.723)#11,208 |
| 46. | 89411 | 3.7% | 3.5%(+0.215)#46 | 4.4%(-0.729)#11,230 |
| 47. | 89021 | 3.7% | 3.5%(+0.189)#47 | 4.4%(-0.755)#11,315 |
| 48. | 89012 | 3.6% | 3.5%(+0.157)#48 | 4.4%(-0.787)#11,411 |
| 49. | 89451 | 3.6% | 3.5%(+0.157)#49 | 4.4%(-0.787)#11,413 |
| 50. | 89521 | 3.6% | 3.5%(+0.154)#50 | 4.4%(-0.790)#11,426 |
| 51. | 89145 | 3.6% | 3.5%(+0.140)#51 | 4.4%(-0.804)#11,474 |
| 52. | 89178 | 3.5% | 3.5%(+0.073)#52 | 4.4%(-0.871)#11,720 |
| 53. | 89147 | 3.5% | 3.5%(+0.070)#53 | 4.4%(-0.874)#11,730 |
| 54. | 89508 | 3.5% | 3.5%(+0.059)#54 | 4.4%(-0.885)#11,772 |
| 55. | 89406 | 3.5% | 3.5%(+0.049)#55 | 4.4%(-0.895)#11,803 |
| 56. | 89027 | 3.4% | 3.5%(-0.046)#56 | 4.4%(-0.990)#12,116 |
| 57. | 89131 | 3.4% | 3.5%(-0.101)#57 | 4.4%(-1.04)#12,290 |
| 58. | 89419 | 3.3% | 3.5%(-0.212)#58 | 4.4%(-1.16)#12,709 |
| 59. | 89179 | 3.2% | 3.5%(-0.219)#59 | 4.4%(-1.16)#12,736 |
| 60. | 89011 | 3.2% | 3.5%(-0.314)#60 | 4.4%(-1.26)#13,051 |
| 61. | 89431 | 3.1% | 3.5%(-0.340)#61 | 4.4%(-1.28)#13,125 |
| 62. | 89706 | 3.1% | 3.5%(-0.384)#62 | 4.4%(-1.33)#13,283 |
| 63. | 89002 | 3.1% | 3.5%(-0.394)#63 | 4.4%(-1.34)#13,326 |
| 64. | 89441 | 3.1% | 3.5%(-0.408)#64 | 4.4%(-1.35)#13,377 |
| 65. | 89815 | 3.0% | 3.5%(-0.430)#65 | 4.4%(-1.37)#13,452 |
| 66. | 89103 | 3.0% | 3.5%(-0.430)#66 | 4.4%(-1.37)#13,454 |
| 67. | 89104 | 3.0% | 3.5%(-0.447)#67 | 4.4%(-1.39)#13,518 |
| 68. | 89506 | 3.0% | 3.5%(-0.468)#68 | 4.4%(-1.41)#13,589 |
| 69. | 89044 | 3.0% | 3.5%(-0.489)#69 | 4.4%(-1.43)#13,659 |
| 70. | 89502 | 2.9% | 3.5%(-0.524)#70 | 4.4%(-1.47)#13,755 |
| 71. | 89139 | 2.9% | 3.5%(-0.570)#71 | 4.4%(-1.51)#13,915 |
| 72. | 89410 | 2.8% | 3.5%(-0.659)#72 | 4.4%(-1.60)#14,240 |
| 73. | 89143 | 2.8% | 3.5%(-0.675)#73 | 4.4%(-1.62)#14,300 |
| 74. | 89109 | 2.7% | 3.5%(-0.742)#74 | 4.4%(-1.69)#14,544 |
| 75. | 89423 | 2.7% | 3.5%(-0.744)#75 | 4.4%(-1.69)#14,551 |
| 76. | 89031 | 2.6% | 3.5%(-0.826)#76 | 4.4%(-1.77)#14,802 |
| 77. | 89025 | 2.6% | 3.5%(-0.902)#77 | 4.4%(-1.85)#15,079 |
| 78. | 89436 | 2.5% | 3.5%(-0.999)#78 | 4.4%(-1.94)#15,443 |
| 79. | 89445 | 2.5% | 3.5%(-1.01)#79 | 4.4%(-1.96)#15,493 |
| 80. | 89048 | 2.4% | 3.5%(-1.08)#80 | 4.4%(-2.02)#15,709 |
| 81. | 89108 | 2.3% | 3.5%(-1.13)#81 | 4.4%(-2.07)#15,896 |
| 82. | 89148 | 2.3% | 3.5%(-1.13)#82 | 4.4%(-2.08)#15,927 |
| 83. | 89113 | 2.3% | 3.5%(-1.14)#83 | 4.4%(-2.08)#15,937 |
| 84. | 89183 | 2.2% | 3.5%(-1.25)#84 | 4.4%(-2.19)#16,342 |
| 85. | 89146 | 2.2% | 3.5%(-1.27)#85 | 4.4%(-2.22)#16,424 |
| 86. | 89081 | 2.2% | 3.5%(-1.29)#86 | 4.4%(-2.23)#16,467 |
| 87. | 89801 | 2.1% | 3.5%(-1.36)#87 | 4.4%(-2.30)#16,699 |
| 88. | 89034 | 2.1% | 3.5%(-1.39)#88 | 4.4%(-2.34)#16,832 |
| 89. | 89149 | 1.9% | 3.5%(-1.52)#89 | 4.4%(-2.46)#17,255 |
| 90. | 89156 | 1.8% | 3.5%(-1.65)#90 | 4.4%(-2.59)#17,659 |
| 91. | 89460 | 1.7% | 3.5%(-1.79)#91 | 4.4%(-2.74)#18,107 |
| 92. | 89015 | 1.6% | 3.5%(-1.89)#92 | 4.4%(-2.84)#18,421 |
| 93. | 89429 | 1.6% | 3.5%(-1.89)#93 | 4.4%(-2.84)#18,423 |
| 94. | 89032 | 1.5% | 3.5%(-1.94)#94 | 4.4%(-2.88)#18,580 |
| 95. | 89122 | 1.5% | 3.5%(-1.95)#95 | 4.4%(-2.89)#18,600 |
| 96. | 89301 | 1.5% | 3.5%(-1.96)#96 | 4.4%(-2.90)#18,654 |
| 97. | 89403 | 1.5% | 3.5%(-1.97)#97 | 4.4%(-2.91)#18,673 |
| 98. | 89014 | 1.4% | 3.5%(-2.06)#98 | 4.4%(-3.00)#18,977 |
| 99. | 89085 | 1.3% | 3.5%(-2.15)#99 | 4.4%(-3.09)#19,224 |
| 100. | 89084 | 1.3% | 3.5%(-2.19)#100 | 4.4%(-3.14)#19,385 |
1
2Common Questions
What are the Top 10 Zip Codes with the Highest Percentage of Population with a Degree in Literature and Languages in Nevada?
Top 10 Zip Codes with the Highest Percentage of Population with a Degree in Literature and Languages in Nevada are:
What zip code has the Highest Percentage of Population with a Degree in Literature and Languages in Nevada?
89404 has the Highest Percentage of Population with a Degree in Literature and Languages in Nevada with 100.0%.
What is the Percentage of Population with a Degree in Literature and Languages in the State of Nevada?
Percentage of Population with a Degree in Literature and Languages in Nevada is 3.5%.
What is the Percentage of Population with a Degree in Literature and Languages in the United States?
Percentage of Population with a Degree in Literature and Languages in the United States is 4.4%.