Zip Codes with the Highest Percentage of Population with a Degree in Literature and Languages in Puerto Rico
RELATED REPORTS & OPTIONS
Literature and Languages
Puerto Rico
Compare Zip Codes
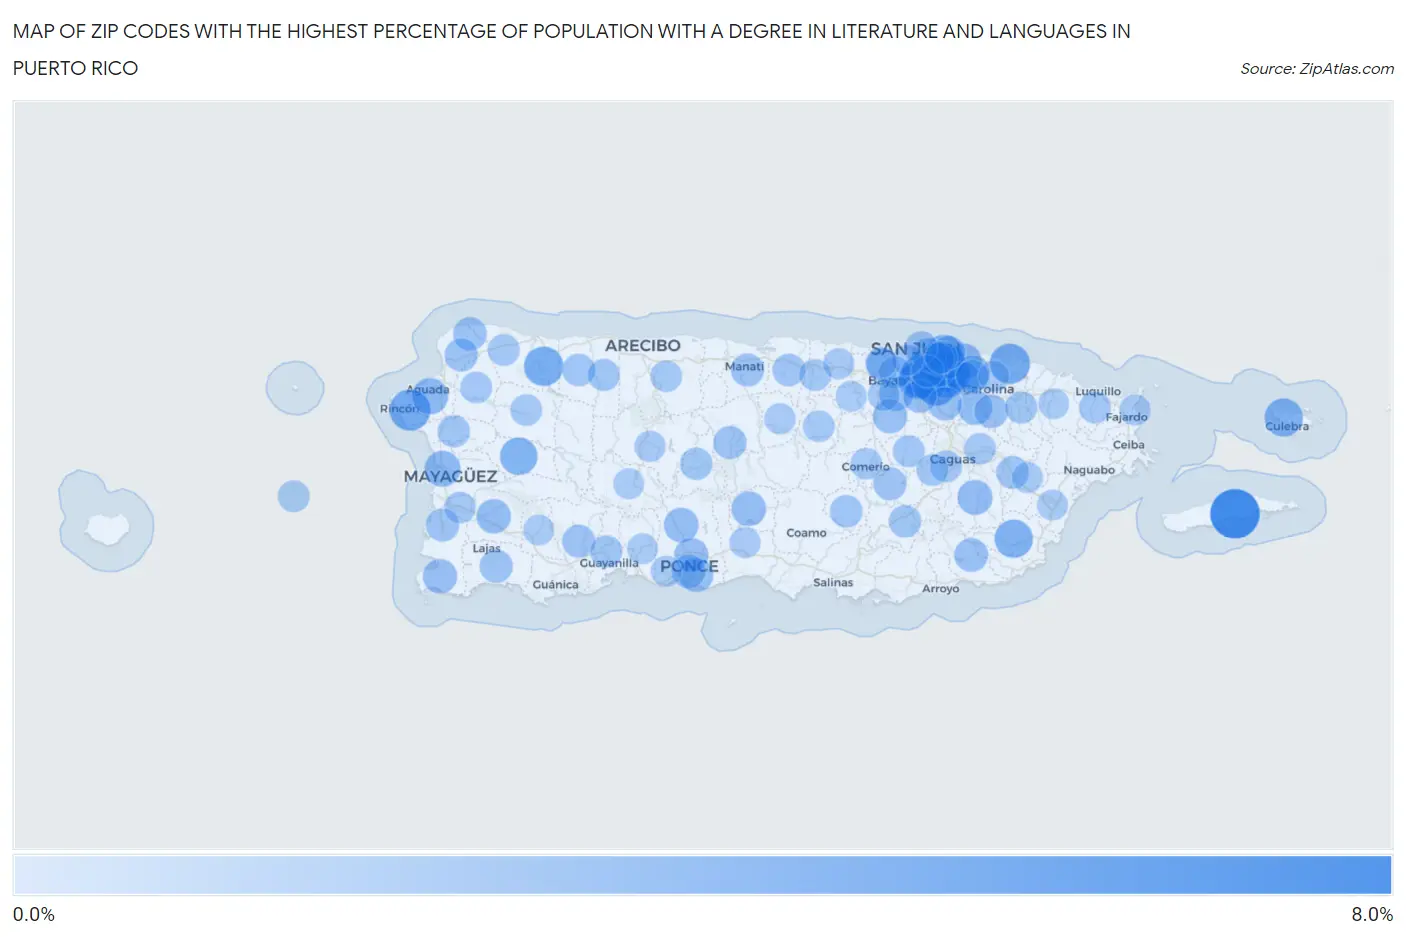
Map of Zip Codes with the Highest Percentage of Population with a Degree in Literature and Languages in Puerto Rico
0.0%
8.0%
Zip Codes with the Highest Percentage of Population with a Degree in Literature and Languages in Puerto Rico
| Zip Code | % Graduates | vs State | vs National | |
| 1. | 00765 | 7.3% | 1.0%(+6.30)#1 | 4.4%(+2.91)#3,634 |
| 2. | 00968 | 5.1% | 1.0%(+4.11)#2 | 4.4%(+0.722)#7,067 |
| 3. | 00917 | 4.9% | 1.0%(+3.84)#3 | 4.4%(+0.444)#7,758 |
| 4. | 00927 | 4.2% | 1.0%(+3.15)#4 | 4.4%(-0.246)#9,733 |
| 5. | 00677 | 4.0% | 1.0%(+2.97)#5 | 4.4%(-0.425)#10,213 |
| 6. | 00772 | 3.7% | 1.0%(+2.72)#6 | 4.4%(-0.669)#11,023 |
| 7. | 00678 | 3.4% | 1.0%(+2.39)#7 | 4.4%(-1.000)#12,150 |
| 8. | 00923 | 3.3% | 1.0%(+2.28)#8 | 4.4%(-1.11)#12,534 |
| 9. | 00925 | 3.3% | 1.0%(+2.24)#9 | 4.4%(-1.15)#12,695 |
| 10. | 00775 | 3.0% | 1.0%(+2.01)#10 | 4.4%(-1.38)#13,475 |
| 11. | 00767 | 3.0% | 1.0%(+1.98)#11 | 4.4%(-1.41)#13,572 |
| 12. | 00966 | 2.8% | 1.0%(+1.83)#12 | 4.4%(-1.56)#14,086 |
| 13. | 00911 | 2.8% | 1.0%(+1.77)#13 | 4.4%(-1.62)#14,313 |
| 14. | 00670 | 2.7% | 1.0%(+1.70)#14 | 4.4%(-1.69)#14,549 |
| 15. | 00918 | 2.4% | 1.0%(+1.39)#15 | 4.4%(-2.00)#15,636 |
| 16. | 00602 | 2.2% | 1.0%(+1.22)#16 | 4.4%(-2.17)#16,269 |
| 17. | 00682 | 2.1% | 1.0%(+1.12)#17 | 4.4%(-2.27)#16,617 |
| 18. | 00979 | 2.1% | 1.0%(+1.07)#18 | 4.4%(-2.32)#16,782 |
| 19. | 00915 | 2.1% | 1.0%(+1.06)#19 | 4.4%(-2.33)#16,808 |
| 20. | 00754 | 1.8% | 1.0%(+0.733)#20 | 4.4%(-2.66)#17,860 |
| 21. | 00731 | 1.7% | 1.0%(+0.633)#21 | 4.4%(-2.76)#18,187 |
| 22. | 00976 | 1.6% | 1.0%(+0.605)#22 | 4.4%(-2.79)#18,284 |
| 23. | 00766 | 1.6% | 1.0%(+0.584)#23 | 4.4%(-2.81)#18,337 |
| 24. | 00921 | 1.6% | 1.0%(+0.550)#24 | 4.4%(-2.84)#18,437 |
| 25. | 00983 | 1.6% | 1.0%(+0.544)#25 | 4.4%(-2.85)#18,464 |
| 26. | 00683 | 1.6% | 1.0%(+0.543)#26 | 4.4%(-2.85)#18,469 |
| 27. | 00959 | 1.5% | 1.0%(+0.531)#27 | 4.4%(-2.86)#18,505 |
| 28. | 00622 | 1.5% | 1.0%(+0.488)#28 | 4.4%(-2.90)#18,657 |
| 29. | 00956 | 1.5% | 1.0%(+0.457)#29 | 4.4%(-2.94)#18,757 |
| 30. | 00716 | 1.4% | 1.0%(+0.426)#30 | 4.4%(-2.97)#18,861 |
| 31. | 00730 | 1.4% | 1.0%(+0.425)#31 | 4.4%(-2.97)#18,865 |
| 32. | 00907 | 1.4% | 1.0%(+0.407)#32 | 4.4%(-2.99)#18,919 |
| 33. | 00717 | 1.3% | 1.0%(+0.320)#33 | 4.4%(-3.07)#19,164 |
| 34. | 00924 | 1.3% | 1.0%(+0.275)#34 | 4.4%(-3.12)#19,321 |
| 35. | 00926 | 1.3% | 1.0%(+0.261)#35 | 4.4%(-3.13)#19,362 |
| 36. | 00987 | 1.3% | 1.0%(+0.244)#36 | 4.4%(-3.15)#19,412 |
| 37. | 00723 | 1.2% | 1.0%(+0.227)#37 | 4.4%(-3.16)#19,452 |
| 38. | 00913 | 1.2% | 1.0%(+0.201)#38 | 4.4%(-3.19)#19,522 |
| 39. | 00690 | 1.2% | 1.0%(+0.187)#39 | 4.4%(-3.20)#19,562 |
| 40. | 00969 | 1.2% | 1.0%(+0.143)#40 | 4.4%(-3.25)#19,693 |
| 41. | 00603 | 1.1% | 1.0%(+0.099)#41 | 4.4%(-3.29)#19,821 |
| 42. | 00674 | 1.1% | 1.0%(+0.067)#42 | 4.4%(-3.32)#19,916 |
| 43. | 00623 | 1.1% | 1.0%(+0.052)#43 | 4.4%(-3.34)#19,945 |
| 44. | 00667 | 1.1% | 1.0%(+0.051)#44 | 4.4%(-3.34)#19,946 |
| 45. | 00638 | 1.1% | 1.0%(+0.047)#45 | 4.4%(-3.35)#19,955 |
| 46. | 00909 | 1.1% | 1.0%(+0.046)#46 | 4.4%(-3.35)#19,957 |
| 47. | 00739 | 1.1% | 1.0%(+0.036)#47 | 4.4%(-3.36)#19,994 |
| 48. | 00698 | 0.97% | 1.0%(-0.046)#48 | 4.4%(-3.44)#20,195 |
| 49. | 00952 | 0.97% | 1.0%(-0.052)#49 | 4.4%(-3.44)#20,210 |
| 50. | 00982 | 0.93% | 1.0%(-0.089)#50 | 4.4%(-3.48)#20,308 |
| 51. | 00777 | 0.89% | 1.0%(-0.129)#51 | 4.4%(-3.52)#20,388 |
| 52. | 00705 | 0.88% | 1.0%(-0.139)#52 | 4.4%(-3.53)#20,412 |
| 53. | 00693 | 0.87% | 1.0%(-0.146)#53 | 4.4%(-3.54)#20,433 |
| 54. | 00901 | 0.87% | 1.0%(-0.152)#54 | 4.4%(-3.54)#20,448 |
| 55. | 00920 | 0.86% | 1.0%(-0.157)#55 | 4.4%(-3.55)#20,456 |
| 56. | 00627 | 0.83% | 1.0%(-0.191)#56 | 4.4%(-3.58)#20,541 |
| 57. | 00664 | 0.78% | 1.0%(-0.242)#57 | 4.4%(-3.63)#20,669 |
| 58. | 00736 | 0.77% | 1.0%(-0.245)#58 | 4.4%(-3.64)#20,678 |
| 59. | 00610 | 0.76% | 1.0%(-0.254)#59 | 4.4%(-3.65)#20,698 |
| 60. | 00912 | 0.73% | 1.0%(-0.283)#60 | 4.4%(-3.67)#20,762 |
| 61. | 00656 | 0.69% | 1.0%(-0.328)#61 | 4.4%(-3.72)#20,869 |
| 62. | 00659 | 0.69% | 1.0%(-0.329)#62 | 4.4%(-3.72)#20,871 |
| 63. | 00729 | 0.68% | 1.0%(-0.336)#63 | 4.4%(-3.73)#20,887 |
| 64. | 00961 | 0.65% | 1.0%(-0.371)#64 | 4.4%(-3.76)#20,955 |
| 65. | 00692 | 0.60% | 1.0%(-0.417)#65 | 4.4%(-3.81)#21,049 |
| 66. | 00703 | 0.60% | 1.0%(-0.422)#66 | 4.4%(-3.81)#21,061 |
| 67. | 00725 | 0.56% | 1.0%(-0.456)#67 | 4.4%(-3.85)#21,127 |
| 68. | 00773 | 0.56% | 1.0%(-0.460)#68 | 4.4%(-3.85)#21,135 |
| 69. | 00727 | 0.55% | 1.0%(-0.468)#69 | 4.4%(-3.86)#21,153 |
| 70. | 00680 | 0.55% | 1.0%(-0.471)#70 | 4.4%(-3.86)#21,159 |
| 71. | 00676 | 0.54% | 1.0%(-0.480)#71 | 4.4%(-3.87)#21,182 |
| 72. | 00662 | 0.52% | 1.0%(-0.494)#72 | 4.4%(-3.89)#21,203 |
| 73. | 00957 | 0.50% | 1.0%(-0.514)#73 | 4.4%(-3.91)#21,252 |
| 74. | 00612 | 0.50% | 1.0%(-0.515)#74 | 4.4%(-3.91)#21,253 |
| 75. | 00685 | 0.50% | 1.0%(-0.515)#75 | 4.4%(-3.91)#21,256 |
| 76. | 00778 | 0.49% | 1.0%(-0.532)#76 | 4.4%(-3.92)#21,272 |
| 77. | 00660 | 0.45% | 1.0%(-0.566)#77 | 4.4%(-3.96)#21,328 |
| 78. | 00782 | 0.44% | 1.0%(-0.576)#78 | 4.4%(-3.97)#21,346 |
| 79. | 00783 | 0.44% | 1.0%(-0.578)#79 | 4.4%(-3.97)#21,352 |
| 80. | 00687 | 0.35% | 1.0%(-0.668)#80 | 4.4%(-4.06)#21,474 |
| 81. | 00962 | 0.34% | 1.0%(-0.673)#81 | 4.4%(-4.07)#21,480 |
| 82. | 00646 | 0.32% | 1.0%(-0.701)#82 | 4.4%(-4.09)#21,515 |
| 83. | 00949 | 0.30% | 1.0%(-0.713)#83 | 4.4%(-4.11)#21,526 |
| 84. | 00641 | 0.30% | 1.0%(-0.717)#84 | 4.4%(-4.11)#21,531 |
| 85. | 00738 | 0.28% | 1.0%(-0.734)#85 | 4.4%(-4.13)#21,551 |
| 86. | 00985 | 0.27% | 1.0%(-0.744)#86 | 4.4%(-4.14)#21,558 |
| 87. | 00771 | 0.27% | 1.0%(-0.749)#87 | 4.4%(-4.14)#21,561 |
| 88. | 00795 | 0.26% | 1.0%(-0.760)#88 | 4.4%(-4.15)#21,581 |
| 89. | 00728 | 0.22% | 1.0%(-0.794)#89 | 4.4%(-4.19)#21,619 |
| 90. | 00791 | 0.21% | 1.0%(-0.811)#90 | 4.4%(-4.20)#21,630 |
| 91. | 00601 | 0.19% | 1.0%(-0.828)#91 | 4.4%(-4.22)#21,643 |
| 92. | 00624 | 0.19% | 1.0%(-0.830)#92 | 4.4%(-4.22)#21,646 |
| 93. | 00745 | 0.18% | 1.0%(-0.835)#93 | 4.4%(-4.23)#21,649 |
| 94. | 00637 | 0.17% | 1.0%(-0.852)#94 | 4.4%(-4.24)#21,658 |
| 95. | 00953 | 0.16% | 1.0%(-0.855)#95 | 4.4%(-4.25)#21,659 |
1
2Common Questions
What are the Top 10 Zip Codes with the Highest Percentage of Population with a Degree in Literature and Languages in Puerto Rico?
Top 10 Zip Codes with the Highest Percentage of Population with a Degree in Literature and Languages in Puerto Rico are:
What zip code has the Highest Percentage of Population with a Degree in Literature and Languages in Puerto Rico?
00765 has the Highest Percentage of Population with a Degree in Literature and Languages in Puerto Rico with 7.3%.
What is the Percentage of Population with a Degree in Literature and Languages in the State of Puerto Rico?
Percentage of Population with a Degree in Literature and Languages in Puerto Rico is 1.0%.
What is the Percentage of Population with a Degree in Literature and Languages in the United States?
Percentage of Population with a Degree in Literature and Languages in the United States is 4.4%.