Zip Codes with the Highest Percentage of Population with a Degree in Literature and Languages in South Carolina
RELATED REPORTS & OPTIONS
Literature and Languages
South Carolina
Compare Zip Codes
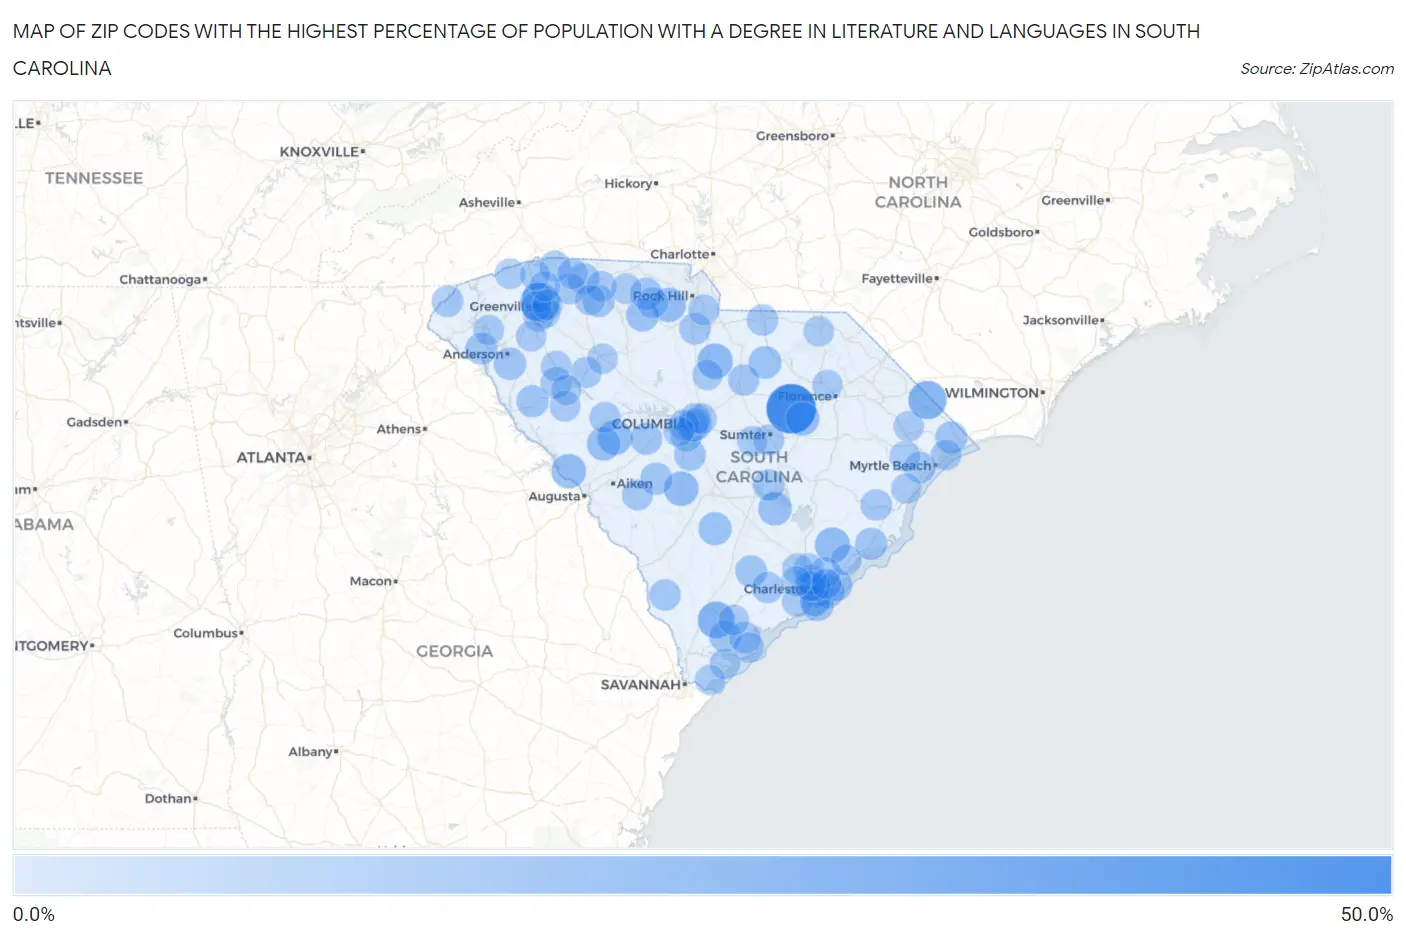
Map of Zip Codes with the Highest Percentage of Population with a Degree in Literature and Languages in South Carolina
0.0%
50.0%
Zip Codes with the Highest Percentage of Population with a Degree in Literature and Languages in South Carolina
| Zip Code | % Graduates | vs State | vs National | |
| 1. | 29046 | 50.0% | 3.7%(+46.3)#1 | 4.4%(+45.6)#71 |
| 2. | 29614 | 25.0% | 3.7%(+21.3)#2 | 4.4%(+20.6)#304 |
| 3. | 29545 | 22.6% | 3.7%(+18.9)#3 | 4.4%(+18.2)#371 |
| 4. | 29941 | 19.7% | 3.7%(+15.9)#4 | 4.4%(+15.2)#493 |
| 5. | 29074 | 16.4% | 3.7%(+12.7)#5 | 4.4%(+12.0)#678 |
| 6. | 29450 | 15.6% | 3.7%(+11.8)#6 | 4.4%(+11.2)#765 |
| 7. | 29166 | 14.7% | 3.7%(+10.9)#7 | 4.4%(+10.3)#851 |
| 8. | 29107 | 14.1% | 3.7%(+10.4)#8 | 4.4%(+9.69)#916 |
| 9. | 29821 | 14.1% | 3.7%(+10.3)#9 | 4.4%(+9.67)#919 |
| 10. | 29401 | 13.5% | 3.7%(+9.76)#10 | 4.4%(+9.09)#979 |
| 11. | 29726 | 13.4% | 3.7%(+9.63)#11 | 4.4%(+8.96)#999 |
| 12. | 29080 | 12.4% | 3.7%(+8.71)#12 | 4.4%(+8.04)#1,151 |
| 13. | 29482 | 11.8% | 3.7%(+8.06)#13 | 4.4%(+7.39)#1,256 |
| 14. | 29832 | 11.8% | 3.7%(+8.05)#14 | 4.4%(+7.38)#1,257 |
| 15. | 29048 | 11.5% | 3.7%(+7.74)#15 | 4.4%(+7.07)#1,336 |
| 16. | 29432 | 10.9% | 3.7%(+7.16)#16 | 4.4%(+6.48)#1,506 |
| 17. | 29364 | 10.5% | 3.7%(+6.79)#17 | 4.4%(+6.12)#1,625 |
| 18. | 29009 | 10.3% | 3.7%(+6.53)#18 | 4.4%(+5.86)#1,722 |
| 19. | 29137 | 9.2% | 3.7%(+5.50)#19 | 4.4%(+4.83)#2,186 |
| 20. | 29624 | 9.2% | 3.7%(+5.46)#20 | 4.4%(+4.78)#2,213 |
| 21. | 29439 | 9.1% | 3.7%(+5.38)#21 | 4.4%(+4.70)#2,252 |
| 22. | 29205 | 9.1% | 3.7%(+5.34)#22 | 4.4%(+4.67)#2,288 |
| 23. | 29717 | 9.0% | 3.7%(+5.26)#23 | 4.4%(+4.59)#2,317 |
| 24. | 29451 | 8.8% | 3.7%(+5.09)#24 | 4.4%(+4.41)#2,409 |
| 25. | 29568 | 8.7% | 3.7%(+4.98)#25 | 4.4%(+4.31)#2,464 |
| 26. | 29620 | 8.6% | 3.7%(+4.85)#26 | 4.4%(+4.18)#2,553 |
| 27. | 29458 | 8.5% | 3.7%(+4.81)#27 | 4.4%(+4.13)#2,583 |
| 28. | 29070 | 8.4% | 3.7%(+4.70)#28 | 4.4%(+4.03)#2,655 |
| 29. | 29689 | 8.2% | 3.7%(+4.45)#29 | 4.4%(+3.77)#2,835 |
| 30. | 29474 | 7.9% | 3.7%(+4.18)#30 | 4.4%(+3.51)#3,051 |
| 31. | 29302 | 7.6% | 3.7%(+3.90)#31 | 4.4%(+3.23)#3,316 |
| 32. | 29906 | 7.5% | 3.7%(+3.77)#32 | 4.4%(+3.09)#3,432 |
| 33. | 29160 | 7.5% | 3.7%(+3.75)#33 | 4.4%(+3.08)#3,450 |
| 34. | 29907 | 7.5% | 3.7%(+3.75)#34 | 4.4%(+3.07)#3,458 |
| 35. | 29664 | 7.4% | 3.7%(+3.69)#35 | 4.4%(+3.01)#3,528 |
| 36. | 29729 | 7.4% | 3.7%(+3.65)#36 | 4.4%(+2.98)#3,563 |
| 37. | 29316 | 7.3% | 3.7%(+3.60)#37 | 4.4%(+2.93)#3,617 |
| 38. | 29148 | 7.3% | 3.7%(+3.52)#38 | 4.4%(+2.85)#3,702 |
| 39. | 29426 | 7.1% | 3.7%(+3.41)#39 | 4.4%(+2.73)#3,809 |
| 40. | 29440 | 7.1% | 3.7%(+3.32)#40 | 4.4%(+2.65)#3,935 |
| 41. | 29728 | 7.0% | 3.7%(+3.30)#41 | 4.4%(+2.62)#3,964 |
| 42. | 29918 | 6.9% | 3.7%(+3.13)#42 | 4.4%(+2.46)#4,154 |
| 43. | 29020 | 6.8% | 3.7%(+3.08)#43 | 4.4%(+2.41)#4,218 |
| 44. | 29588 | 6.8% | 3.7%(+3.08)#44 | 4.4%(+2.40)#4,223 |
| 45. | 29742 | 6.6% | 3.7%(+2.83)#45 | 4.4%(+2.16)#4,540 |
| 46. | 29385 | 6.4% | 3.7%(+2.68)#46 | 4.4%(+2.00)#4,780 |
| 47. | 29492 | 6.4% | 3.7%(+2.64)#47 | 4.4%(+1.97)#4,826 |
| 48. | 29138 | 6.3% | 3.7%(+2.52)#48 | 4.4%(+1.85)#4,999 |
| 49. | 29172 | 6.1% | 3.7%(+2.39)#49 | 4.4%(+1.72)#5,214 |
| 50. | 29201 | 6.0% | 3.7%(+2.30)#50 | 4.4%(+1.62)#5,372 |
| 51. | 29653 | 6.0% | 3.7%(+2.26)#51 | 4.4%(+1.59)#5,416 |
| 52. | 29204 | 6.0% | 3.7%(+2.26)#52 | 4.4%(+1.58)#5,420 |
| 53. | 29370 | 5.9% | 3.7%(+2.20)#53 | 4.4%(+1.53)#5,522 |
| 54. | 29356 | 5.9% | 3.7%(+2.15)#54 | 4.4%(+1.48)#5,613 |
| 55. | 29455 | 5.8% | 3.7%(+2.09)#55 | 4.4%(+1.42)#5,705 |
| 56. | 29150 | 5.8% | 3.7%(+2.09)#56 | 4.4%(+1.41)#5,716 |
| 57. | 29704 | 5.8% | 3.7%(+2.03)#57 | 4.4%(+1.35)#5,819 |
| 58. | 29856 | 5.7% | 3.7%(+1.92)#58 | 4.4%(+1.25)#6,010 |
| 59. | 29169 | 5.7% | 3.7%(+1.92)#59 | 4.4%(+1.25)#6,022 |
| 60. | 29429 | 5.6% | 3.7%(+1.82)#60 | 4.4%(+1.14)#6,231 |
| 61. | 29607 | 5.5% | 3.7%(+1.80)#61 | 4.4%(+1.12)#6,256 |
| 62. | 29206 | 5.5% | 3.7%(+1.76)#62 | 4.4%(+1.08)#6,339 |
| 63. | 29605 | 5.5% | 3.7%(+1.72)#63 | 4.4%(+1.05)#6,399 |
| 64. | 29412 | 5.3% | 3.7%(+1.60)#64 | 4.4%(+0.928)#6,641 |
| 65. | 29692 | 5.3% | 3.7%(+1.60)#65 | 4.4%(+0.924)#6,648 |
| 66. | 29511 | 5.3% | 3.7%(+1.57)#66 | 4.4%(+0.898)#6,709 |
| 67. | 29920 | 5.3% | 3.7%(+1.57)#67 | 4.4%(+0.891)#6,726 |
| 68. | 29646 | 5.3% | 3.7%(+1.55)#68 | 4.4%(+0.873)#6,764 |
| 69. | 29349 | 5.3% | 3.7%(+1.51)#69 | 4.4%(+0.841)#6,848 |
| 70. | 29403 | 5.2% | 3.7%(+1.46)#70 | 4.4%(+0.787)#6,951 |
| 71. | 29940 | 5.2% | 3.7%(+1.45)#71 | 4.4%(+0.772)#6,987 |
| 72. | 29572 | 5.2% | 3.7%(+1.44)#72 | 4.4%(+0.771)#6,990 |
| 73. | 29669 | 5.1% | 3.7%(+1.38)#73 | 4.4%(+0.709)#7,093 |
| 74. | 29405 | 5.0% | 3.7%(+1.29)#74 | 4.4%(+0.614)#7,299 |
| 75. | 29926 | 4.9% | 3.7%(+1.19)#75 | 4.4%(+0.513)#7,549 |
| 76. | 29307 | 4.9% | 3.7%(+1.18)#76 | 4.4%(+0.508)#7,561 |
| 77. | 29410 | 4.9% | 3.7%(+1.16)#77 | 4.4%(+0.488)#7,629 |
| 78. | 29520 | 4.8% | 3.7%(+1.11)#78 | 4.4%(+0.438)#7,771 |
| 79. | 29532 | 4.8% | 3.7%(+1.09)#79 | 4.4%(+0.421)#7,815 |
| 80. | 29154 | 4.8% | 3.7%(+1.08)#80 | 4.4%(+0.406)#7,854 |
| 81. | 29407 | 4.8% | 3.7%(+1.06)#81 | 4.4%(+0.387)#7,896 |
| 82. | 29609 | 4.8% | 3.7%(+1.06)#82 | 4.4%(+0.386)#7,897 |
| 83. | 29170 | 4.8% | 3.7%(+1.05)#83 | 4.4%(+0.373)#7,944 |
| 84. | 29601 | 4.7% | 3.7%(+1.00)#84 | 4.4%(+0.326)#8,070 |
| 85. | 29631 | 4.7% | 3.7%(+0.997)#85 | 4.4%(+0.324)#8,077 |
| 86. | 29649 | 4.7% | 3.7%(+0.960)#86 | 4.4%(+0.286)#8,173 |
| 87. | 29615 | 4.7% | 3.7%(+0.959)#87 | 4.4%(+0.285)#8,175 |
| 88. | 29527 | 4.7% | 3.7%(+0.925)#88 | 4.4%(+0.251)#8,263 |
| 89. | 29420 | 4.6% | 3.7%(+0.859)#89 | 4.4%(+0.186)#8,443 |
| 90. | 29635 | 4.6% | 3.7%(+0.856)#90 | 4.4%(+0.182)#8,461 |
| 91. | 29585 | 4.6% | 3.7%(+0.850)#91 | 4.4%(+0.176)#8,476 |
| 92. | 29464 | 4.6% | 3.7%(+0.828)#92 | 4.4%(+0.154)#8,536 |
| 93. | 29687 | 4.6% | 3.7%(+0.815)#93 | 4.4%(+0.141)#8,565 |
| 94. | 29690 | 4.5% | 3.7%(+0.764)#94 | 4.4%(+0.091)#8,717 |
| 95. | 29340 | 4.4% | 3.7%(+0.680)#95 | 4.4%(+0.007)#8,953 |
| 96. | 29325 | 4.4% | 3.7%(+0.660)#96 | 4.4%(-0.013)#9,000 |
| 97. | 29130 | 4.4% | 3.7%(+0.628)#97 | 4.4%(-0.046)#9,105 |
| 98. | 29414 | 4.3% | 3.7%(+0.612)#98 | 4.4%(-0.061)#9,148 |
| 99. | 29306 | 4.3% | 3.7%(+0.585)#99 | 4.4%(-0.089)#9,239 |
| 100. | 29915 | 4.3% | 3.7%(+0.534)#100 | 4.4%(-0.140)#9,402 |
Common Questions
What are the Top 10 Zip Codes with the Highest Percentage of Population with a Degree in Literature and Languages in South Carolina?
Top 10 Zip Codes with the Highest Percentage of Population with a Degree in Literature and Languages in South Carolina are:
What zip code has the Highest Percentage of Population with a Degree in Literature and Languages in South Carolina?
29046 has the Highest Percentage of Population with a Degree in Literature and Languages in South Carolina with 50.0%.
What is the Percentage of Population with a Degree in Literature and Languages in the State of South Carolina?
Percentage of Population with a Degree in Literature and Languages in South Carolina is 3.7%.
What is the Percentage of Population with a Degree in Literature and Languages in the United States?
Percentage of Population with a Degree in Literature and Languages in the United States is 4.4%.