Zip Codes with the Highest Percentage of Population with a Degree in Literature and Languages in Maine
RELATED REPORTS & OPTIONS
Literature and Languages
Maine
Compare Zip Codes
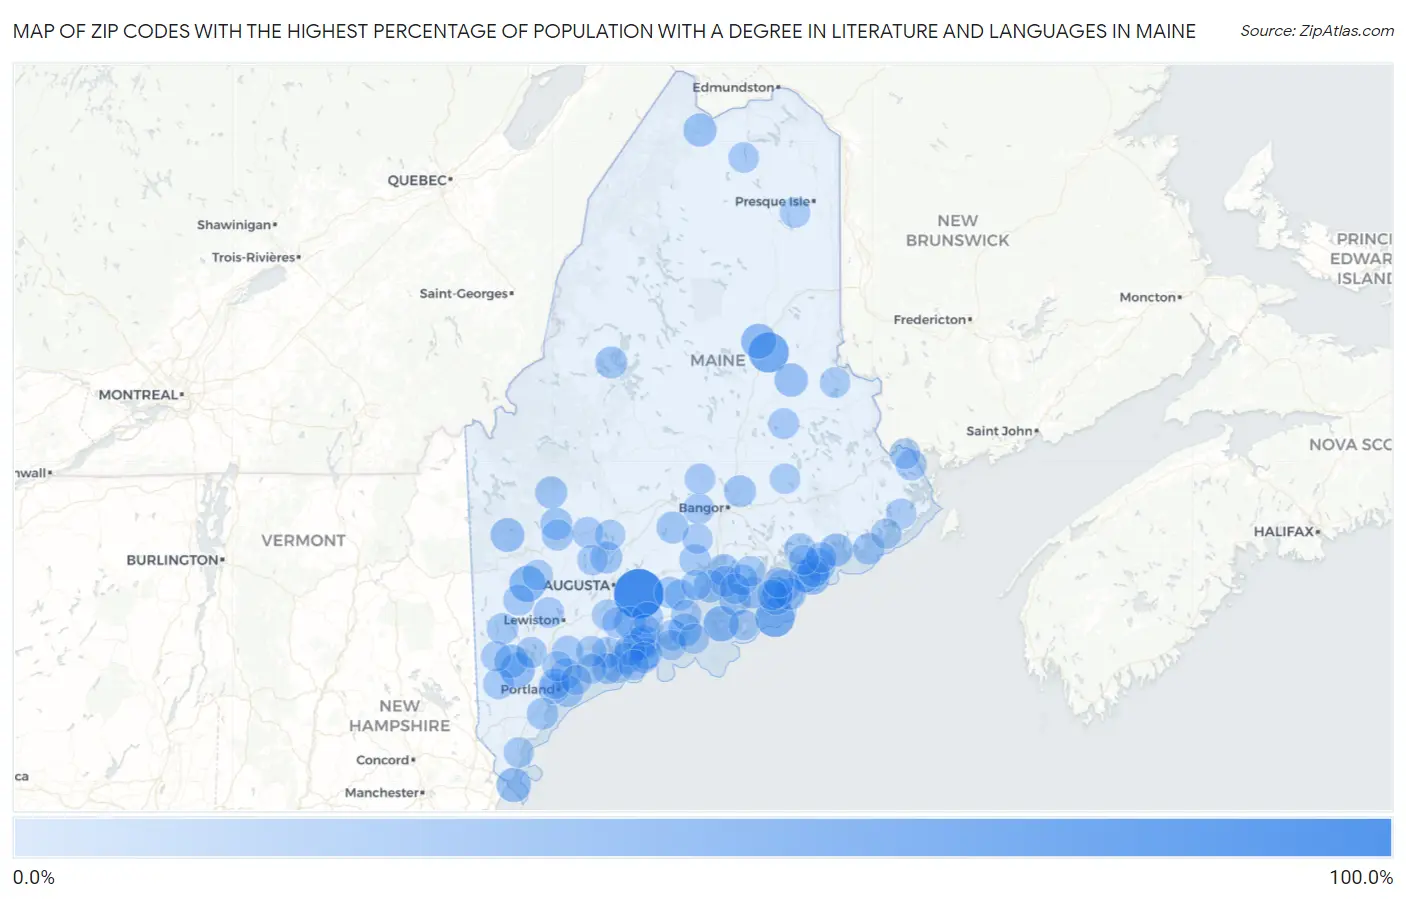
Map of Zip Codes with the Highest Percentage of Population with a Degree in Literature and Languages in Maine
0.0%
100.0%
Zip Codes with the Highest Percentage of Population with a Degree in Literature and Languages in Maine
| Zip Code | % Graduates | vs State | vs National | |
| 1. | 04341 | 100.0% | 7.0%(+93.0)#1 | 4.4%(+95.6)#21 |
| 2. | 04733 | 55.0% | 7.0%(+48.0)#2 | 4.4%(+50.6)#48 |
| 3. | 04635 | 50.0% | 7.0%(+43.0)#3 | 4.4%(+45.6)#80 |
| 4. | 04289 | 36.0% | 7.0%(+29.0)#4 | 4.4%(+31.6)#140 |
| 5. | 04863 | 32.6% | 7.0%(+25.5)#5 | 4.4%(+28.1)#176 |
| 6. | 04777 | 31.2% | 7.0%(+24.2)#6 | 4.4%(+26.8)#190 |
| 7. | 04085 | 29.3% | 7.0%(+22.2)#7 | 4.4%(+24.9)#209 |
| 8. | 04613 | 27.8% | 7.0%(+20.8)#8 | 4.4%(+23.4)#238 |
| 9. | 03905 | 27.5% | 7.0%(+20.5)#9 | 4.4%(+23.1)#242 |
| 10. | 04226 | 25.0% | 7.0%(+18.0)#10 | 4.4%(+20.6)#315 |
| 11. | 04662 | 24.7% | 7.0%(+17.7)#11 | 4.4%(+20.3)#321 |
| 12. | 04539 | 24.2% | 7.0%(+17.2)#12 | 4.4%(+19.8)#329 |
| 13. | 04024 | 23.9% | 7.0%(+16.9)#13 | 4.4%(+19.5)#337 |
| 14. | 04451 | 23.1% | 7.0%(+16.1)#14 | 4.4%(+18.7)#357 |
| 15. | 04624 | 22.7% | 7.0%(+15.6)#15 | 4.4%(+18.3)#367 |
| 16. | 04774 | 22.4% | 7.0%(+15.3)#16 | 4.4%(+18.0)#379 |
| 17. | 04643 | 21.7% | 7.0%(+14.7)#17 | 4.4%(+17.3)#407 |
| 18. | 04858 | 20.3% | 7.0%(+13.3)#18 | 4.4%(+15.9)#461 |
| 19. | 04848 | 19.4% | 7.0%(+12.4)#19 | 4.4%(+15.0)#505 |
| 20. | 04653 | 18.9% | 7.0%(+11.8)#20 | 4.4%(+14.4)#530 |
| 21. | 04573 | 18.8% | 7.0%(+11.8)#21 | 4.4%(+14.4)#532 |
| 22. | 04693 | 18.0% | 7.0%(+11.0)#22 | 4.4%(+13.6)#577 |
| 23. | 04983 | 17.4% | 7.0%(+10.3)#23 | 4.4%(+13.0)#610 |
| 24. | 04646 | 17.1% | 7.0%(+10.0)#24 | 4.4%(+12.7)#634 |
| 25. | 04917 | 16.8% | 7.0%(+9.72)#25 | 4.4%(+12.3)#645 |
| 26. | 04421 | 16.7% | 7.0%(+9.69)#26 | 4.4%(+12.3)#646 |
| 27. | 04987 | 16.7% | 7.0%(+9.64)#27 | 4.4%(+12.3)#649 |
| 28. | 04535 | 16.3% | 7.0%(+9.30)#28 | 4.4%(+11.9)#685 |
| 29. | 04469 | 16.2% | 7.0%(+9.19)#29 | 4.4%(+11.8)#696 |
| 30. | 04669 | 16.2% | 7.0%(+9.19)#30 | 4.4%(+11.8)#699 |
| 31. | 04984 | 16.2% | 7.0%(+9.16)#31 | 4.4%(+11.8)#701 |
| 32. | 04478 | 16.2% | 7.0%(+9.16)#32 | 4.4%(+11.8)#702 |
| 33. | 04108 | 15.4% | 7.0%(+8.36)#33 | 4.4%(+11.0)#781 |
| 34. | 04627 | 15.4% | 7.0%(+8.33)#34 | 4.4%(+10.9)#788 |
| 35. | 04616 | 15.2% | 7.0%(+8.18)#35 | 4.4%(+10.8)#800 |
| 36. | 04063 | 14.7% | 7.0%(+7.64)#36 | 4.4%(+10.3)#853 |
| 37. | 04649 | 14.2% | 7.0%(+7.18)#37 | 4.4%(+9.79)#904 |
| 38. | 04575 | 14.2% | 7.0%(+7.13)#38 | 4.4%(+9.75)#912 |
| 39. | 04541 | 14.0% | 7.0%(+6.93)#39 | 4.4%(+9.54)#930 |
| 40. | 04862 | 13.9% | 7.0%(+6.92)#40 | 4.4%(+9.53)#931 |
| 41. | 04294 | 13.6% | 7.0%(+6.57)#41 | 4.4%(+9.19)#968 |
| 42. | 04548 | 13.4% | 7.0%(+6.41)#42 | 4.4%(+9.03)#987 |
| 43. | 04915 | 13.4% | 7.0%(+6.40)#43 | 4.4%(+9.01)#989 |
| 44. | 04009 | 13.3% | 7.0%(+6.27)#44 | 4.4%(+8.89)#1,013 |
| 45. | 04048 | 13.2% | 7.0%(+6.16)#45 | 4.4%(+8.77)#1,025 |
| 46. | 04530 | 13.2% | 7.0%(+6.13)#46 | 4.4%(+8.75)#1,027 |
| 47. | 04555 | 12.8% | 7.0%(+5.76)#47 | 4.4%(+8.37)#1,084 |
| 48. | 04664 | 12.7% | 7.0%(+5.63)#48 | 4.4%(+8.25)#1,108 |
| 49. | 04069 | 12.6% | 7.0%(+5.54)#49 | 4.4%(+8.15)#1,128 |
| 50. | 04268 | 12.5% | 7.0%(+5.52)#50 | 4.4%(+8.14)#1,132 |
| 51. | 04847 | 12.4% | 7.0%(+5.33)#51 | 4.4%(+7.95)#1,162 |
| 52. | 04537 | 12.0% | 7.0%(+5.02)#52 | 4.4%(+7.64)#1,214 |
| 53. | 04071 | 11.9% | 7.0%(+4.89)#53 | 4.4%(+7.51)#1,236 |
| 54. | 04642 | 11.9% | 7.0%(+4.86)#54 | 4.4%(+7.47)#1,244 |
| 55. | 04110 | 11.9% | 7.0%(+4.85)#55 | 4.4%(+7.46)#1,245 |
| 56. | 04671 | 11.8% | 7.0%(+4.78)#56 | 4.4%(+7.39)#1,255 |
| 57. | 04955 | 11.8% | 7.0%(+4.75)#57 | 4.4%(+7.37)#1,259 |
| 58. | 04676 | 11.6% | 7.0%(+4.59)#58 | 4.4%(+7.20)#1,307 |
| 59. | 04455 | 11.5% | 7.0%(+4.51)#59 | 4.4%(+7.13)#1,324 |
| 60. | 04357 | 11.5% | 7.0%(+4.50)#60 | 4.4%(+7.11)#1,327 |
| 61. | 04543 | 11.5% | 7.0%(+4.46)#61 | 4.4%(+7.08)#1,334 |
| 62. | 04562 | 11.4% | 7.0%(+4.40)#62 | 4.4%(+7.02)#1,346 |
| 63. | 04679 | 11.3% | 7.0%(+4.30)#63 | 4.4%(+6.91)#1,382 |
| 64. | 04619 | 11.2% | 7.0%(+4.18)#64 | 4.4%(+6.80)#1,408 |
| 65. | 04563 | 11.2% | 7.0%(+4.14)#65 | 4.4%(+6.75)#1,414 |
| 66. | 04102 | 11.1% | 7.0%(+4.11)#66 | 4.4%(+6.73)#1,419 |
| 67. | 04554 | 11.0% | 7.0%(+4.02)#67 | 4.4%(+6.63)#1,463 |
| 68. | 04342 | 11.0% | 7.0%(+3.97)#68 | 4.4%(+6.59)#1,476 |
| 69. | 04419 | 10.9% | 7.0%(+3.85)#69 | 4.4%(+6.47)#1,509 |
| 70. | 04352 | 10.8% | 7.0%(+3.73)#70 | 4.4%(+6.35)#1,538 |
| 71. | 04427 | 10.7% | 7.0%(+3.67)#71 | 4.4%(+6.29)#1,555 |
| 72. | 04680 | 10.6% | 7.0%(+3.62)#72 | 4.4%(+6.24)#1,576 |
| 73. | 04544 | 10.4% | 7.0%(+3.38)#73 | 4.4%(+5.99)#1,670 |
| 74. | 04103 | 10.4% | 7.0%(+3.36)#74 | 4.4%(+5.98)#1,674 |
| 75. | 04011 | 10.2% | 7.0%(+3.18)#75 | 4.4%(+5.80)#1,740 |
| 76. | 04258 | 10.2% | 7.0%(+3.16)#76 | 4.4%(+5.78)#1,746 |
| 77. | 04650 | 10.2% | 7.0%(+3.15)#77 | 4.4%(+5.77)#1,749 |
| 78. | 04292 | 10.1% | 7.0%(+3.11)#78 | 4.4%(+5.73)#1,763 |
| 79. | 04739 | 10.1% | 7.0%(+3.09)#79 | 4.4%(+5.70)#1,776 |
| 80. | 04614 | 10.0% | 7.0%(+2.99)#80 | 4.4%(+5.60)#1,812 |
| 81. | 04978 | 9.9% | 7.0%(+2.83)#81 | 4.4%(+5.45)#1,888 |
| 82. | 04408 | 9.8% | 7.0%(+2.81)#82 | 4.4%(+5.43)#1,901 |
| 83. | 04612 | 9.8% | 7.0%(+2.76)#83 | 4.4%(+5.38)#1,919 |
| 84. | 04041 | 9.7% | 7.0%(+2.70)#84 | 4.4%(+5.31)#1,947 |
| 85. | 04645 | 9.7% | 7.0%(+2.65)#85 | 4.4%(+5.27)#1,967 |
| 86. | 04079 | 9.6% | 7.0%(+2.56)#86 | 4.4%(+5.18)#2,003 |
| 87. | 04860 | 9.6% | 7.0%(+2.53)#87 | 4.4%(+5.15)#2,014 |
| 88. | 04413 | 9.5% | 7.0%(+2.50)#88 | 4.4%(+5.11)#2,035 |
| 89. | 04841 | 9.4% | 7.0%(+2.39)#89 | 4.4%(+5.01)#2,079 |
| 90. | 04021 | 9.4% | 7.0%(+2.34)#90 | 4.4%(+4.95)#2,107 |
| 91. | 04691 | 9.4% | 7.0%(+2.33)#91 | 4.4%(+4.95)#2,110 |
| 92. | 04660 | 9.3% | 7.0%(+2.29)#92 | 4.4%(+4.91)#2,139 |
| 93. | 04655 | 9.3% | 7.0%(+2.27)#93 | 4.4%(+4.88)#2,152 |
| 94. | 04854 | 9.3% | 7.0%(+2.23)#94 | 4.4%(+4.84)#2,176 |
| 95. | 04951 | 9.2% | 7.0%(+2.21)#95 | 4.4%(+4.83)#2,185 |
| 96. | 04017 | 9.2% | 7.0%(+2.20)#96 | 4.4%(+4.82)#2,193 |
| 97. | 04757 | 9.2% | 7.0%(+2.18)#97 | 4.4%(+4.79)#2,204 |
| 98. | 03907 | 9.2% | 7.0%(+2.14)#98 | 4.4%(+4.76)#2,225 |
| 99. | 04607 | 9.2% | 7.0%(+2.14)#99 | 4.4%(+4.76)#2,227 |
| 100. | 04849 | 9.1% | 7.0%(+2.10)#100 | 4.4%(+4.72)#2,246 |
Common Questions
What are the Top 10 Zip Codes with the Highest Percentage of Population with a Degree in Literature and Languages in Maine?
Top 10 Zip Codes with the Highest Percentage of Population with a Degree in Literature and Languages in Maine are:
What zip code has the Highest Percentage of Population with a Degree in Literature and Languages in Maine?
04341 has the Highest Percentage of Population with a Degree in Literature and Languages in Maine with 100.0%.
What is the Percentage of Population with a Degree in Literature and Languages in the State of Maine?
Percentage of Population with a Degree in Literature and Languages in Maine is 7.0%.
What is the Percentage of Population with a Degree in Literature and Languages in the United States?
Percentage of Population with a Degree in Literature and Languages in the United States is 4.4%.