Zip Codes with the Highest Percentage of Population with a Degree in Literature and Languages in Kansas
RELATED REPORTS & OPTIONS
Literature and Languages
Kansas
Compare Zip Codes
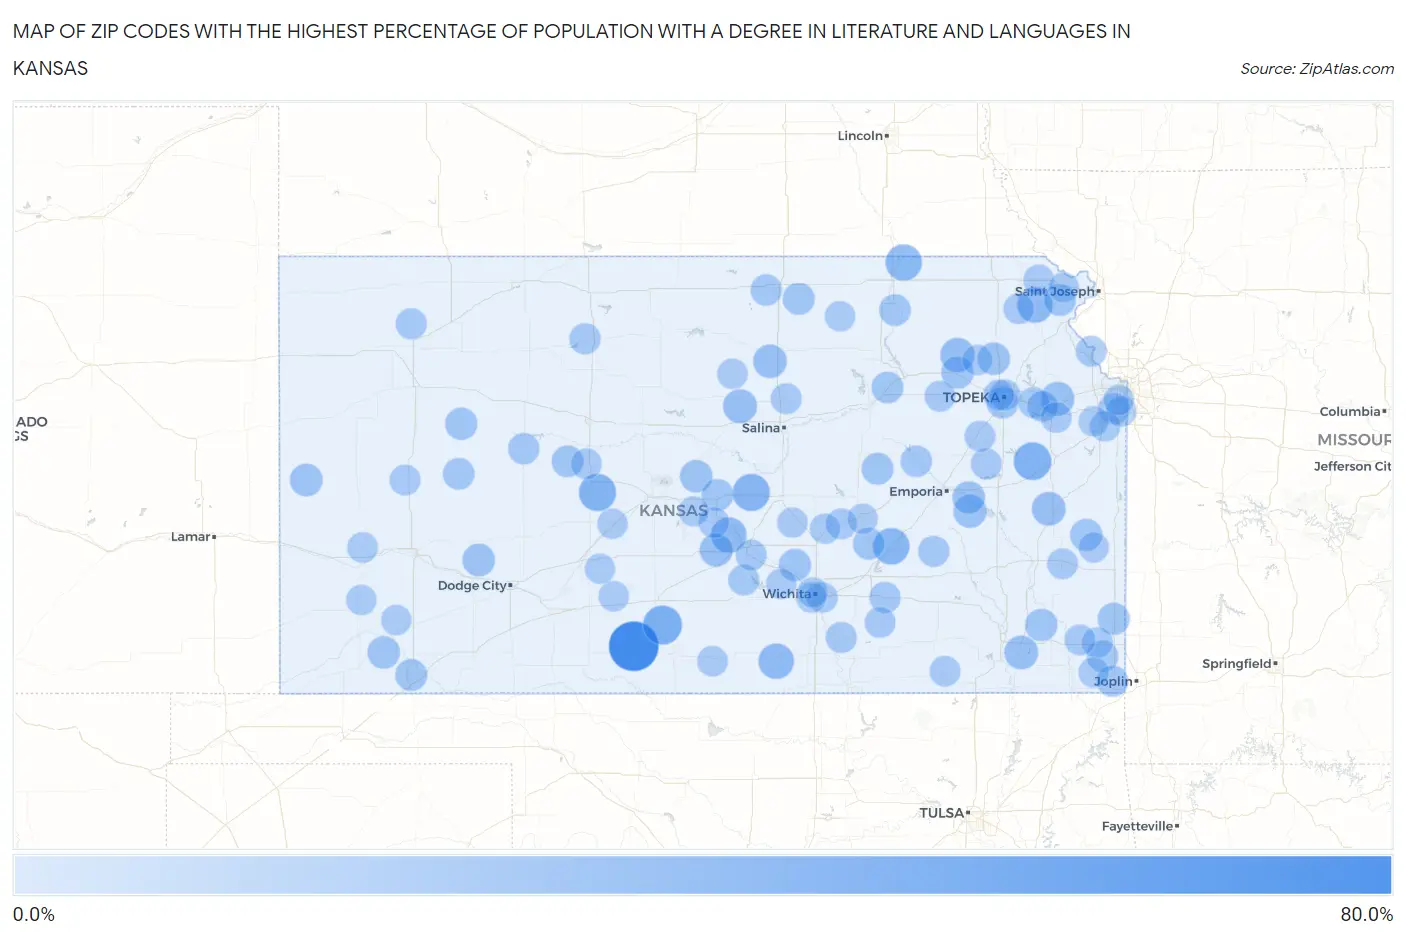
Map of Zip Codes with the Highest Percentage of Population with a Degree in Literature and Languages in Kansas
0.0%
80.0%
Zip Codes with the Highest Percentage of Population with a Degree in Literature and Languages in Kansas
| Zip Code | % Graduates | vs State | vs National | |
| 1. | 67143 | 66.7% | 3.3%(+63.4)#1 | 4.4%(+62.3)#37 |
| 2. | 67134 | 32.0% | 3.3%(+28.7)#2 | 4.4%(+27.6)#184 |
| 3. | 66076 | 27.7% | 3.3%(+24.4)#3 | 4.4%(+23.3)#239 |
| 4. | 67575 | 26.6% | 3.3%(+23.3)#4 | 4.4%(+22.2)#267 |
| 5. | 67491 | 26.2% | 3.3%(+22.9)#5 | 4.4%(+21.8)#277 |
| 6. | 66842 | 24.2% | 3.3%(+20.9)#6 | 4.4%(+19.8)#330 |
| 7. | 66518 | 23.5% | 3.3%(+20.3)#7 | 4.4%(+19.1)#346 |
| 8. | 66424 | 21.2% | 3.3%(+17.9)#8 | 4.4%(+16.8)#427 |
| 9. | 67561 | 20.9% | 3.3%(+17.6)#9 | 4.4%(+16.4)#445 |
| 10. | 67105 | 20.8% | 3.3%(+17.6)#10 | 4.4%(+16.4)#446 |
| 11. | 66422 | 17.1% | 3.3%(+13.9)#11 | 4.4%(+12.7)#626 |
| 12. | 67423 | 16.0% | 3.3%(+12.7)#12 | 4.4%(+11.6)#723 |
| 13. | 66032 | 15.4% | 3.3%(+12.1)#13 | 4.4%(+11.0)#786 |
| 14. | 67436 | 15.1% | 3.3%(+11.8)#14 | 4.4%(+10.7)#804 |
| 15. | 67335 | 15.1% | 3.3%(+11.8)#15 | 4.4%(+10.6)#806 |
| 16. | 66044 | 14.8% | 3.3%(+11.5)#16 | 4.4%(+10.3)#843 |
| 17. | 67510 | 13.9% | 3.3%(+10.6)#17 | 4.4%(+9.48)#937 |
| 18. | 66854 | 13.2% | 3.3%(+9.93)#18 | 4.4%(+8.80)#1,021 |
| 19. | 67879 | 12.1% | 3.3%(+8.80)#19 | 4.4%(+7.67)#1,207 |
| 20. | 67835 | 11.8% | 3.3%(+8.53)#20 | 4.4%(+7.39)#1,254 |
| 21. | 66509 | 11.6% | 3.3%(+8.31)#21 | 4.4%(+7.17)#1,315 |
| 22. | 66864 | 11.5% | 3.3%(+8.26)#22 | 4.4%(+7.13)#1,325 |
| 23. | 67427 | 11.4% | 3.3%(+8.15)#23 | 4.4%(+7.02)#1,354 |
| 24. | 67952 | 11.4% | 3.3%(+8.09)#24 | 4.4%(+6.95)#1,374 |
| 25. | 66536 | 11.4% | 3.3%(+8.08)#25 | 4.4%(+6.95)#1,379 |
| 26. | 66740 | 10.7% | 3.3%(+7.44)#26 | 4.4%(+6.30)#1,551 |
| 27. | 67016 | 10.6% | 3.3%(+7.36)#27 | 4.4%(+6.23)#1,580 |
| 28. | 67736 | 10.5% | 3.3%(+7.25)#28 | 4.4%(+6.12)#1,631 |
| 29. | 66010 | 10.2% | 3.3%(+6.90)#29 | 4.4%(+5.76)#1,753 |
| 30. | 66930 | 10.0% | 3.3%(+6.73)#30 | 4.4%(+5.59)#1,835 |
| 31. | 66735 | 9.9% | 3.3%(+6.64)#31 | 4.4%(+5.50)#1,869 |
| 32. | 67901 | 9.7% | 3.3%(+6.40)#32 | 4.4%(+5.27)#1,968 |
| 33. | 66008 | 9.4% | 3.3%(+6.16)#33 | 4.4%(+5.02)#2,072 |
| 34. | 66611 | 9.4% | 3.3%(+6.12)#34 | 4.4%(+4.98)#2,093 |
| 35. | 67554 | 9.4% | 3.3%(+6.08)#35 | 4.4%(+4.95)#2,113 |
| 36. | 66840 | 9.2% | 3.3%(+5.96)#36 | 4.4%(+4.82)#2,189 |
| 37. | 66517 | 9.2% | 3.3%(+5.94)#37 | 4.4%(+4.80)#2,199 |
| 38. | 67556 | 9.1% | 3.3%(+5.82)#38 | 4.4%(+4.68)#2,283 |
| 39. | 66838 | 9.1% | 3.3%(+5.82)#39 | 4.4%(+4.68)#2,284 |
| 40. | 67839 | 8.8% | 3.3%(+5.49)#40 | 4.4%(+4.35)#2,440 |
| 41. | 66411 | 8.5% | 3.3%(+5.24)#41 | 4.4%(+4.10)#2,605 |
| 42. | 66773 | 8.5% | 3.3%(+5.18)#42 | 4.4%(+4.04)#2,646 |
| 43. | 66846 | 8.1% | 3.3%(+4.85)#43 | 4.4%(+3.71)#2,882 |
| 44. | 67572 | 8.1% | 3.3%(+4.79)#44 | 4.4%(+3.65)#2,935 |
| 45. | 66966 | 7.9% | 3.3%(+4.64)#45 | 4.4%(+3.50)#3,056 |
| 46. | 66770 | 7.7% | 3.3%(+4.47)#46 | 4.4%(+3.34)#3,203 |
| 47. | 66853 | 7.5% | 3.3%(+4.23)#47 | 4.4%(+3.09)#3,439 |
| 48. | 67669 | 7.3% | 3.3%(+4.03)#48 | 4.4%(+2.90)#3,656 |
| 49. | 67074 | 7.2% | 3.3%(+3.94)#49 | 4.4%(+2.80)#3,744 |
| 50. | 67734 | 7.1% | 3.3%(+3.87)#50 | 4.4%(+2.73)#3,827 |
| 51. | 66214 | 6.8% | 3.3%(+3.51)#51 | 4.4%(+2.37)#4,261 |
| 52. | 66603 | 6.8% | 3.3%(+3.51)#52 | 4.4%(+2.37)#4,266 |
| 53. | 67570 | 6.7% | 3.3%(+3.43)#53 | 4.4%(+2.29)#4,355 |
| 54. | 67146 | 6.7% | 3.3%(+3.42)#54 | 4.4%(+2.28)#4,373 |
| 55. | 67501 | 6.5% | 3.3%(+3.27)#55 | 4.4%(+2.13)#4,584 |
| 56. | 66050 | 6.5% | 3.3%(+3.26)#56 | 4.4%(+2.13)#4,592 |
| 57. | 66027 | 6.5% | 3.3%(+3.22)#57 | 4.4%(+2.09)#4,644 |
| 58. | 66049 | 6.5% | 3.3%(+3.22)#58 | 4.4%(+2.08)#4,646 |
| 59. | 66724 | 6.4% | 3.3%(+3.13)#59 | 4.4%(+1.99)#4,792 |
| 60. | 66523 | 6.4% | 3.3%(+3.10)#60 | 4.4%(+1.96)#4,834 |
| 61. | 66413 | 6.3% | 3.3%(+3.03)#61 | 4.4%(+1.89)#4,926 |
| 62. | 66753 | 6.3% | 3.3%(+3.01)#62 | 4.4%(+1.87)#4,957 |
| 63. | 67422 | 6.2% | 3.3%(+2.98)#63 | 4.4%(+1.84)#5,008 |
| 64. | 67871 | 6.2% | 3.3%(+2.90)#64 | 4.4%(+1.76)#5,133 |
| 65. | 66866 | 6.2% | 3.3%(+2.89)#65 | 4.4%(+1.76)#5,141 |
| 66. | 66532 | 6.1% | 3.3%(+2.85)#66 | 4.4%(+1.71)#5,231 |
| 67. | 66501 | 6.1% | 3.3%(+2.79)#67 | 4.4%(+1.65)#5,330 |
| 68. | 67579 | 6.1% | 3.3%(+2.78)#68 | 4.4%(+1.64)#5,342 |
| 69. | 66046 | 6.1% | 3.3%(+2.78)#69 | 4.4%(+1.64)#5,344 |
| 70. | 67860 | 5.9% | 3.3%(+2.61)#70 | 4.4%(+1.47)#5,620 |
| 71. | 67008 | 5.9% | 3.3%(+2.61)#71 | 4.4%(+1.47)#5,633 |
| 72. | 66606 | 5.9% | 3.3%(+2.59)#72 | 4.4%(+1.45)#5,663 |
| 73. | 67548 | 5.9% | 3.3%(+2.58)#73 | 4.4%(+1.45)#5,673 |
| 74. | 67361 | 5.7% | 3.3%(+2.45)#74 | 4.4%(+1.32)#5,886 |
| 75. | 66755 | 5.7% | 3.3%(+2.40)#75 | 4.4%(+1.26)#5,996 |
| 76. | 66439 | 5.6% | 3.3%(+2.28)#76 | 4.4%(+1.15)#6,215 |
| 77. | 67009 | 5.4% | 3.3%(+2.13)#77 | 4.4%(+0.996)#6,505 |
| 78. | 67059 | 5.3% | 3.3%(+1.99)#78 | 4.4%(+0.854)#6,809 |
| 79. | 67870 | 5.1% | 3.3%(+1.87)#79 | 4.4%(+0.731)#7,060 |
| 80. | 67218 | 5.1% | 3.3%(+1.83)#80 | 4.4%(+0.690)#7,123 |
| 81. | 66062 | 5.1% | 3.3%(+1.82)#81 | 4.4%(+0.686)#7,132 |
| 82. | 67418 | 4.9% | 3.3%(+1.66)#82 | 4.4%(+0.529)#7,517 |
| 83. | 67001 | 4.9% | 3.3%(+1.65)#83 | 4.4%(+0.517)#7,537 |
| 84. | 66207 | 4.9% | 3.3%(+1.63)#84 | 4.4%(+0.492)#7,620 |
| 85. | 66962 | 4.9% | 3.3%(+1.60)#85 | 4.4%(+0.468)#7,680 |
| 86. | 67107 | 4.9% | 3.3%(+1.60)#86 | 4.4%(+0.461)#7,699 |
| 87. | 66061 | 4.8% | 3.3%(+1.52)#87 | 4.4%(+0.384)#7,902 |
| 88. | 66087 | 4.7% | 3.3%(+1.43)#88 | 4.4%(+0.291)#8,161 |
| 89. | 66725 | 4.7% | 3.3%(+1.42)#89 | 4.4%(+0.285)#8,177 |
| 90. | 67151 | 4.7% | 3.3%(+1.38)#90 | 4.4%(+0.242)#8,296 |
| 91. | 67213 | 4.6% | 3.3%(+1.37)#91 | 4.4%(+0.238)#8,303 |
| 92. | 67550 | 4.6% | 3.3%(+1.36)#92 | 4.4%(+0.223)#8,346 |
| 93. | 66202 | 4.6% | 3.3%(+1.36)#93 | 4.4%(+0.221)#8,348 |
| 94. | 67552 | 4.6% | 3.3%(+1.36)#94 | 4.4%(+0.220)#8,351 |
| 95. | 66851 | 4.6% | 3.3%(+1.32)#95 | 4.4%(+0.188)#8,438 |
| 96. | 67880 | 4.6% | 3.3%(+1.29)#96 | 4.4%(+0.153)#8,538 |
| 97. | 67203 | 4.6% | 3.3%(+1.28)#97 | 4.4%(+0.144)#8,563 |
| 98. | 66418 | 4.5% | 3.3%(+1.27)#98 | 4.4%(+0.136)#8,602 |
| 99. | 66754 | 4.5% | 3.3%(+1.27)#99 | 4.4%(+0.136)#8,603 |
| 100. | 67573 | 4.5% | 3.3%(+1.27)#100 | 4.4%(+0.136)#8,604 |
Common Questions
What are the Top 10 Zip Codes with the Highest Percentage of Population with a Degree in Literature and Languages in Kansas?
Top 10 Zip Codes with the Highest Percentage of Population with a Degree in Literature and Languages in Kansas are:
What zip code has the Highest Percentage of Population with a Degree in Literature and Languages in Kansas?
67143 has the Highest Percentage of Population with a Degree in Literature and Languages in Kansas with 66.7%.
What is the Percentage of Population with a Degree in Literature and Languages in the State of Kansas?
Percentage of Population with a Degree in Literature and Languages in Kansas is 3.3%.
What is the Percentage of Population with a Degree in Literature and Languages in the United States?
Percentage of Population with a Degree in Literature and Languages in the United States is 4.4%.