Zip Codes with the Highest Percentage of Population with a Degree in Literature and Languages in Nebraska
RELATED REPORTS & OPTIONS
Literature and Languages
Nebraska
Compare Zip Codes
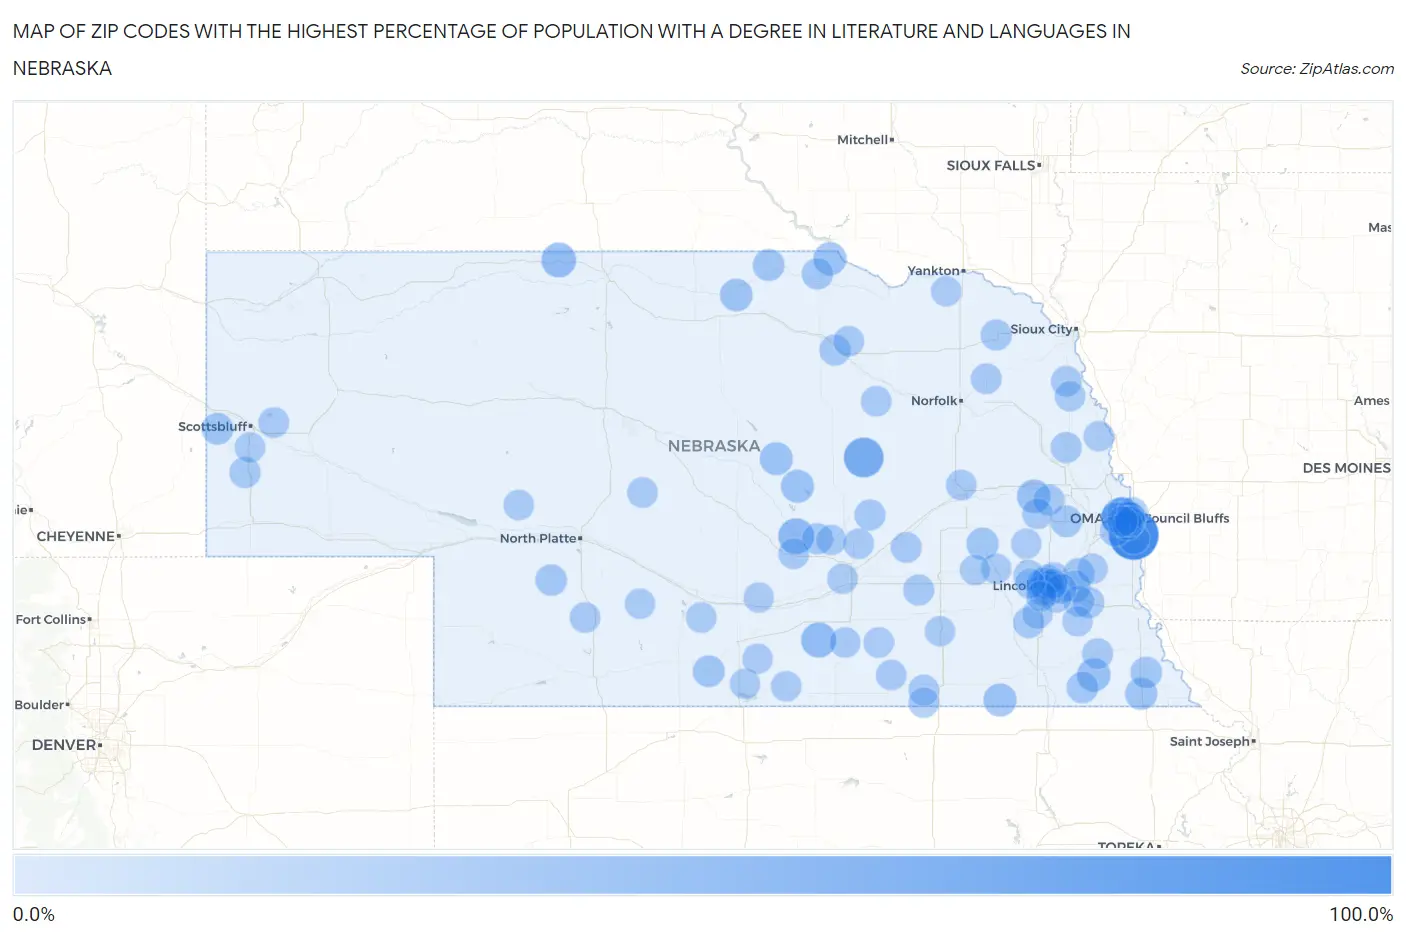
Map of Zip Codes with the Highest Percentage of Population with a Degree in Literature and Languages in Nebraska
0.0%
100.0%
Zip Codes with the Highest Percentage of Population with a Degree in Literature and Languages in Nebraska
| Zip Code | % Graduates | vs State | vs National | |
| 1. | 68056 | 100.0% | 3.1%(+96.9)#1 | 4.4%(+95.6)#24 |
| 2. | 68182 | 50.0% | 3.1%(+46.9)#2 | 4.4%(+45.6)#59 |
| 3. | 68655 | 50.0% | 3.1%(+46.9)#3 | 4.4%(+45.6)#70 |
| 4. | 68871 | 30.6% | 3.1%(+27.4)#4 | 4.4%(+26.1)#198 |
| 5. | 68950 | 26.7% | 3.1%(+23.6)#5 | 4.4%(+22.3)#264 |
| 6. | 69216 | 25.0% | 3.1%(+21.9)#6 | 4.4%(+20.6)#312 |
| 7. | 68648 | 19.2% | 3.1%(+16.1)#7 | 4.4%(+14.8)#512 |
| 8. | 68441 | 18.9% | 3.1%(+15.8)#8 | 4.4%(+14.5)#527 |
| 9. | 68719 | 17.4% | 3.1%(+14.3)#9 | 4.4%(+13.0)#609 |
| 10. | 68350 | 16.7% | 3.1%(+13.6)#10 | 4.4%(+12.3)#655 |
| 11. | 68837 | 16.7% | 3.1%(+13.6)#11 | 4.4%(+12.3)#661 |
| 12. | 68859 | 16.5% | 3.1%(+13.3)#12 | 4.4%(+12.0)#671 |
| 13. | 68759 | 14.9% | 3.1%(+11.8)#13 | 4.4%(+10.5)#824 |
| 14. | 68337 | 12.8% | 3.1%(+9.70)#14 | 4.4%(+8.41)#1,079 |
| 15. | 68669 | 12.4% | 3.1%(+9.27)#15 | 4.4%(+7.97)#1,158 |
| 16. | 69352 | 11.1% | 3.1%(+8.00)#16 | 4.4%(+6.70)#1,433 |
| 17. | 68755 | 11.1% | 3.1%(+8.00)#17 | 4.4%(+6.70)#1,440 |
| 18. | 68967 | 10.8% | 3.1%(+7.72)#18 | 4.4%(+6.43)#1,518 |
| 19. | 68323 | 10.0% | 3.1%(+6.88)#19 | 4.4%(+5.59)#1,830 |
| 20. | 68442 | 10.0% | 3.1%(+6.88)#20 | 4.4%(+5.59)#1,831 |
| 21. | 69132 | 10.0% | 3.1%(+6.88)#21 | 4.4%(+5.59)#1,834 |
| 22. | 68304 | 9.9% | 3.1%(+6.76)#22 | 4.4%(+5.47)#1,882 |
| 23. | 68178 | 9.3% | 3.1%(+6.22)#23 | 4.4%(+4.92)#2,130 |
| 24. | 68041 | 9.2% | 3.1%(+6.09)#24 | 4.4%(+4.79)#2,206 |
| 25. | 68347 | 9.0% | 3.1%(+5.93)#25 | 4.4%(+4.64)#2,294 |
| 26. | 68777 | 8.7% | 3.1%(+5.58)#26 | 4.4%(+4.29)#2,485 |
| 27. | 68132 | 8.4% | 3.1%(+5.28)#27 | 4.4%(+3.99)#2,683 |
| 28. | 68131 | 8.1% | 3.1%(+5.02)#28 | 4.4%(+3.72)#2,876 |
| 29. | 68368 | 8.1% | 3.1%(+5.01)#29 | 4.4%(+3.72)#2,878 |
| 30. | 68742 | 7.9% | 3.1%(+4.78)#30 | 4.4%(+3.49)#3,071 |
| 31. | 69345 | 7.8% | 3.1%(+4.73)#31 | 4.4%(+3.43)#3,115 |
| 32. | 68820 | 7.8% | 3.1%(+4.70)#32 | 4.4%(+3.40)#3,148 |
| 33. | 68454 | 7.7% | 3.1%(+4.58)#33 | 4.4%(+3.28)#3,262 |
| 34. | 68745 | 7.5% | 3.1%(+4.37)#34 | 4.4%(+3.08)#3,457 |
| 35. | 68508 | 7.3% | 3.1%(+4.21)#35 | 4.4%(+2.92)#3,631 |
| 36. | 68015 | 7.2% | 3.1%(+4.12)#36 | 4.4%(+2.83)#3,719 |
| 37. | 68113 | 7.1% | 3.1%(+4.03)#37 | 4.4%(+2.73)#3,818 |
| 38. | 68503 | 7.1% | 3.1%(+3.98)#38 | 4.4%(+2.69)#3,868 |
| 39. | 68371 | 7.1% | 3.1%(+3.98)#39 | 4.4%(+2.68)#3,878 |
| 40. | 68864 | 7.0% | 3.1%(+3.89)#40 | 4.4%(+2.60)#3,986 |
| 41. | 68510 | 7.0% | 3.1%(+3.86)#41 | 4.4%(+2.56)#4,026 |
| 42. | 68063 | 6.8% | 3.1%(+3.66)#42 | 4.4%(+2.37)#4,270 |
| 43. | 68450 | 6.6% | 3.1%(+3.50)#43 | 4.4%(+2.21)#4,476 |
| 44. | 68418 | 6.6% | 3.1%(+3.49)#44 | 4.4%(+2.19)#4,494 |
| 45. | 68846 | 6.2% | 3.1%(+3.13)#45 | 4.4%(+1.84)#5,018 |
| 46. | 68506 | 6.2% | 3.1%(+3.09)#46 | 4.4%(+1.80)#5,079 |
| 47. | 68104 | 5.8% | 3.1%(+2.69)#47 | 4.4%(+1.40)#5,745 |
| 48. | 68504 | 5.8% | 3.1%(+2.64)#48 | 4.4%(+1.35)#5,827 |
| 49. | 68102 | 5.7% | 3.1%(+2.55)#49 | 4.4%(+1.25)#6,009 |
| 50. | 68105 | 5.6% | 3.1%(+2.52)#50 | 4.4%(+1.23)#6,056 |
| 51. | 68790 | 5.6% | 3.1%(+2.49)#51 | 4.4%(+1.20)#6,110 |
| 52. | 68502 | 5.6% | 3.1%(+2.49)#52 | 4.4%(+1.19)#6,123 |
| 53. | 69356 | 5.5% | 3.1%(+2.41)#53 | 4.4%(+1.12)#6,266 |
| 54. | 69120 | 5.5% | 3.1%(+2.38)#54 | 4.4%(+1.09)#6,317 |
| 55. | 68869 | 5.5% | 3.1%(+2.36)#55 | 4.4%(+1.07)#6,364 |
| 56. | 68766 | 5.4% | 3.1%(+2.32)#56 | 4.4%(+1.03)#6,434 |
| 57. | 69038 | 5.3% | 3.1%(+2.22)#57 | 4.4%(+0.924)#6,651 |
| 58. | 68961 | 5.2% | 3.1%(+2.10)#58 | 4.4%(+0.808)#6,915 |
| 59. | 68340 | 5.2% | 3.1%(+2.06)#59 | 4.4%(+0.763)#7,013 |
| 60. | 68872 | 5.1% | 3.1%(+1.99)#60 | 4.4%(+0.700)#7,107 |
| 61. | 68114 | 5.1% | 3.1%(+1.99)#61 | 4.4%(+0.699)#7,110 |
| 62. | 68636 | 5.1% | 3.1%(+1.98)#62 | 4.4%(+0.681)#7,142 |
| 63. | 68110 | 5.1% | 3.1%(+1.97)#63 | 4.4%(+0.673)#7,165 |
| 64. | 68925 | 5.1% | 3.1%(+1.95)#64 | 4.4%(+0.654)#7,202 |
| 65. | 68325 | 5.0% | 3.1%(+1.88)#65 | 4.4%(+0.590)#7,361 |
| 66. | 68601 | 5.0% | 3.1%(+1.87)#66 | 4.4%(+0.578)#7,395 |
| 67. | 68040 | 5.0% | 3.1%(+1.83)#67 | 4.4%(+0.541)#7,489 |
| 68. | 68976 | 4.9% | 3.1%(+1.80)#68 | 4.4%(+0.508)#7,571 |
| 69. | 68067 | 4.8% | 3.1%(+1.72)#69 | 4.4%(+0.429)#7,792 |
| 70. | 68526 | 4.7% | 3.1%(+1.57)#70 | 4.4%(+0.279)#8,189 |
| 71. | 68938 | 4.7% | 3.1%(+1.57)#71 | 4.4%(+0.278)#8,195 |
| 72. | 68507 | 4.7% | 3.1%(+1.56)#72 | 4.4%(+0.264)#8,221 |
| 73. | 69029 | 4.7% | 3.1%(+1.56)#73 | 4.4%(+0.263)#8,224 |
| 74. | 68128 | 4.6% | 3.1%(+1.52)#74 | 4.4%(+0.228)#8,335 |
| 75. | 68520 | 4.6% | 3.1%(+1.44)#75 | 4.4%(+0.145)#8,558 |
| 76. | 68438 | 4.5% | 3.1%(+1.43)#76 | 4.4%(+0.136)#8,608 |
| 77. | 68939 | 4.5% | 3.1%(+1.40)#77 | 4.4%(+0.102)#8,692 |
| 78. | 68810 | 4.5% | 3.1%(+1.38)#78 | 4.4%(+0.085)#8,731 |
| 79. | 69341 | 4.4% | 3.1%(+1.27)#79 | 4.4%(-0.020)#9,022 |
| 80. | 68434 | 4.4% | 3.1%(+1.27)#80 | 4.4%(-0.022)#9,030 |
| 81. | 68456 | 4.4% | 3.1%(+1.26)#81 | 4.4%(-0.030)#9,061 |
| 82. | 68407 | 4.3% | 3.1%(+1.16)#82 | 4.4%(-0.132)#9,372 |
| 83. | 68055 | 4.3% | 3.1%(+1.14)#83 | 4.4%(-0.154)#9,447 |
| 84. | 68730 | 4.2% | 3.1%(+1.09)#84 | 4.4%(-0.199)#9,570 |
| 85. | 69165 | 4.2% | 3.1%(+1.07)#85 | 4.4%(-0.227)#9,655 |
| 86. | 68107 | 4.2% | 3.1%(+1.05)#86 | 4.4%(-0.243)#9,703 |
| 87. | 68061 | 4.1% | 3.1%(+1.01)#87 | 4.4%(-0.286)#9,838 |
| 88. | 68108 | 4.1% | 3.1%(+0.952)#88 | 4.4%(-0.342)#9,998 |
| 89. | 68831 | 4.0% | 3.1%(+0.925)#89 | 4.4%(-0.369)#10,075 |
| 90. | 68344 | 4.0% | 3.1%(+0.925)#90 | 4.4%(-0.369)#10,076 |
| 91. | 68920 | 4.0% | 3.1%(+0.853)#91 | 4.4%(-0.441)#10,275 |
| 92. | 68982 | 4.0% | 3.1%(+0.839)#92 | 4.4%(-0.455)#10,318 |
| 93. | 68065 | 3.9% | 3.1%(+0.813)#93 | 4.4%(-0.481)#10,399 |
| 94. | 68505 | 3.9% | 3.1%(+0.804)#94 | 4.4%(-0.490)#10,430 |
| 95. | 68361 | 3.9% | 3.1%(+0.786)#95 | 4.4%(-0.508)#10,479 |
| 96. | 68524 | 3.9% | 3.1%(+0.778)#96 | 4.4%(-0.516)#10,518 |
| 97. | 68106 | 3.9% | 3.1%(+0.746)#97 | 4.4%(-0.548)#10,627 |
| 98. | 68528 | 3.8% | 3.1%(+0.706)#98 | 4.4%(-0.588)#10,748 |
| 99. | 68512 | 3.8% | 3.1%(+0.671)#99 | 4.4%(-0.623)#10,866 |
| 100. | 68845 | 3.7% | 3.1%(+0.619)#100 | 4.4%(-0.675)#11,042 |
Common Questions
What are the Top 10 Zip Codes with the Highest Percentage of Population with a Degree in Literature and Languages in Nebraska?
Top 10 Zip Codes with the Highest Percentage of Population with a Degree in Literature and Languages in Nebraska are:
What zip code has the Highest Percentage of Population with a Degree in Literature and Languages in Nebraska?
68056 has the Highest Percentage of Population with a Degree in Literature and Languages in Nebraska with 100.0%.
What is the Percentage of Population with a Degree in Literature and Languages in the State of Nebraska?
Percentage of Population with a Degree in Literature and Languages in Nebraska is 3.1%.
What is the Percentage of Population with a Degree in Literature and Languages in the United States?
Percentage of Population with a Degree in Literature and Languages in the United States is 4.4%.