Zip Codes with the Highest Percentage of Households Heated by Fuel Oil / Kerosene in Vermont
RELATED REPORTS & OPTIONS
Fuel Oil Heating
Vermont
Compare Zip Codes
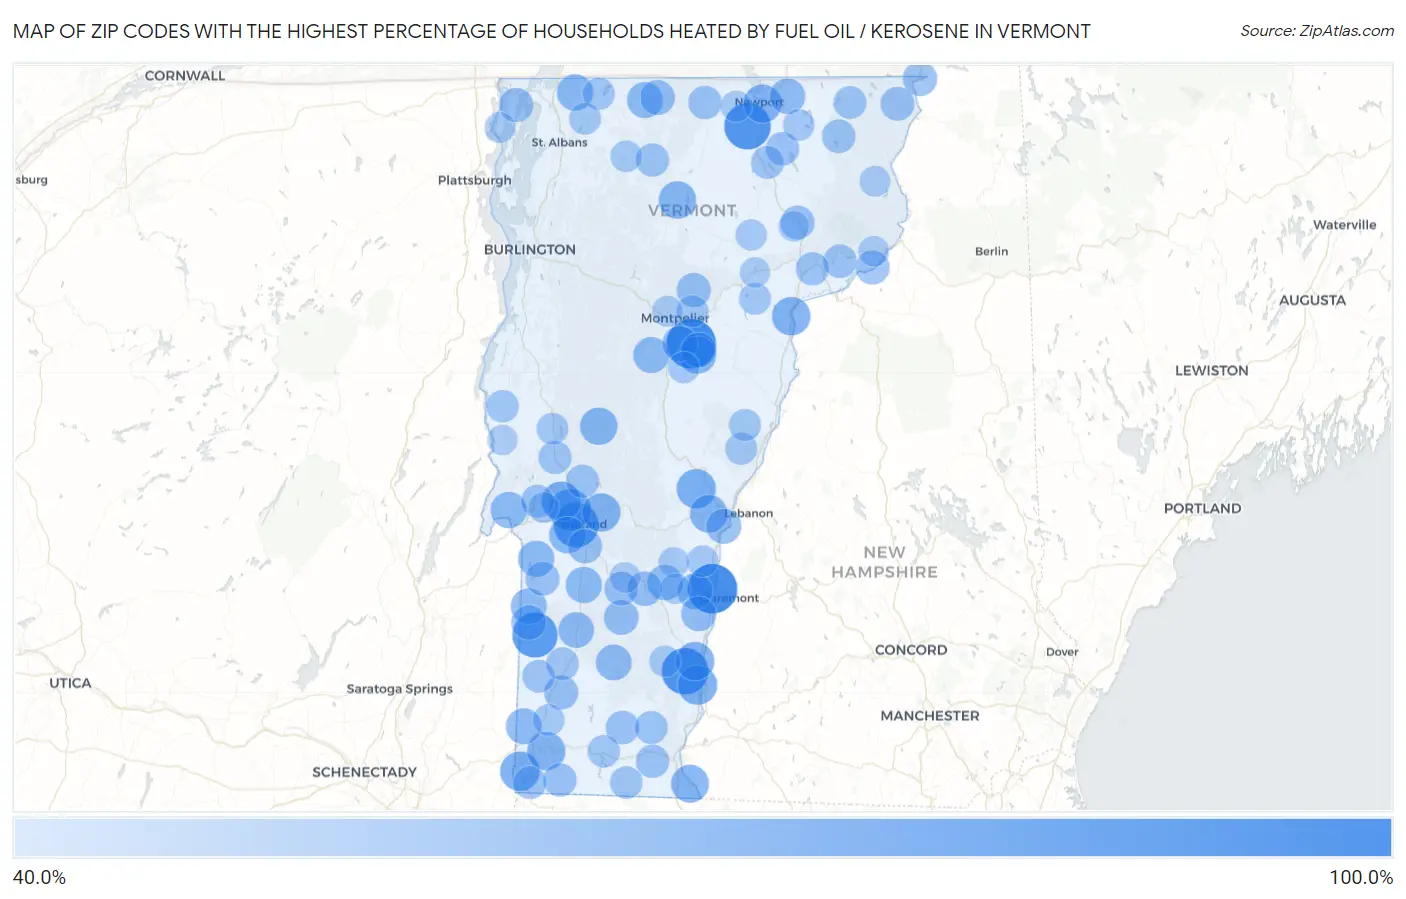
Map of Zip Codes with the Highest Percentage of Households Heated by Fuel Oil / Kerosene in Vermont
40.0%
100.0%
Zip Codes with the Highest Percentage of Households Heated by Fuel Oil / Kerosene in Vermont
| Zip Code | Fuel Oil Heating | vs State | vs National | |
| 1. | 05030 | 100.0% | 40.9%(+59.1)#1 | 4.2%(+95.8)#36 |
| 2. | 05670 | 100.0% | 40.9%(+59.1)#2 | 4.2%(+95.8)#66 |
| 3. | 05154 | 91.9% | 40.9%(+51.0)#3 | 4.2%(+87.7)#146 |
| 4. | 05825 | 91.7% | 40.9%(+50.8)#4 | 4.2%(+87.5)#150 |
| 5. | 05776 | 88.4% | 40.9%(+47.5)#5 | 4.2%(+84.2)#175 |
| 6. | 05736 | 87.2% | 40.9%(+46.3)#6 | 4.2%(+83.0)#188 |
| 7. | 05765 | 80.2% | 40.9%(+39.3)#7 | 4.2%(+76.0)#260 |
| 8. | 05260 | 73.5% | 40.9%(+32.6)#8 | 4.2%(+69.3)#403 |
| 9. | 05744 | 73.4% | 40.9%(+32.5)#9 | 4.2%(+69.2)#406 |
| 10. | 05158 | 73.1% | 40.9%(+32.2)#10 | 4.2%(+68.9)#421 |
| 11. | 05053 | 72.9% | 40.9%(+32.0)#11 | 4.2%(+68.7)#425 |
| 12. | 05101 | 70.9% | 40.9%(+30.0)#12 | 4.2%(+66.7)#478 |
| 13. | 05050 | 70.8% | 40.9%(+29.9)#13 | 4.2%(+66.6)#484 |
| 14. | 05701 | 70.2% | 40.9%(+29.3)#14 | 4.2%(+66.0)#509 |
| 15. | 05201 | 70.2% | 40.9%(+29.3)#15 | 4.2%(+66.0)#510 |
| 16. | 05855 | 70.1% | 40.9%(+29.2)#16 | 4.2%(+65.9)#518 |
| 17. | 05354 | 69.1% | 40.9%(+28.2)#17 | 4.2%(+64.9)#564 |
| 18. | 05059 | 68.6% | 40.9%(+27.7)#18 | 4.2%(+64.4)#586 |
| 19. | 05655 | 68.3% | 40.9%(+27.4)#19 | 4.2%(+64.1)#599 |
| 20. | 05748 | 68.1% | 40.9%(+27.2)#20 | 4.2%(+63.9)#608 |
| 21. | 05654 | 67.9% | 40.9%(+27.0)#21 | 4.2%(+63.7)#618 |
| 22. | 05777 | 65.9% | 40.9%(+25.0)#22 | 4.2%(+61.7)#742 |
| 23. | 05459 | 65.4% | 40.9%(+24.5)#23 | 4.2%(+61.2)#768 |
| 24. | 05743 | 65.1% | 40.9%(+24.2)#24 | 4.2%(+60.9)#784 |
| 25. | 05764 | 64.7% | 40.9%(+23.8)#25 | 4.2%(+60.5)#798 |
| 26. | 05773 | 64.7% | 40.9%(+23.8)#26 | 4.2%(+60.5)#800 |
| 27. | 05447 | 64.4% | 40.9%(+23.5)#27 | 4.2%(+60.2)#827 |
| 28. | 05663 | 64.3% | 40.9%(+23.4)#28 | 4.2%(+60.1)#828 |
| 29. | 05775 | 63.9% | 40.9%(+23.0)#29 | 4.2%(+59.7)#858 |
| 30. | 05155 | 63.7% | 40.9%(+22.8)#30 | 4.2%(+59.5)#874 |
| 31. | 05257 | 63.5% | 40.9%(+22.6)#31 | 4.2%(+59.3)#885 |
| 32. | 05253 | 63.4% | 40.9%(+22.5)#32 | 4.2%(+59.2)#891 |
| 33. | 05153 | 63.2% | 40.9%(+22.3)#33 | 4.2%(+59.0)#901 |
| 34. | 05151 | 63.1% | 40.9%(+22.2)#34 | 4.2%(+58.9)#909 |
| 35. | 05829 | 62.8% | 40.9%(+21.9)#35 | 4.2%(+58.6)#925 |
| 36. | 05641 | 62.0% | 40.9%(+21.1)#36 | 4.2%(+57.8)#963 |
| 37. | 05052 | 61.8% | 40.9%(+20.9)#37 | 4.2%(+57.6)#991 |
| 38. | 05476 | 61.6% | 40.9%(+20.7)#38 | 4.2%(+57.4)#1,002 |
| 39. | 05156 | 61.5% | 40.9%(+20.6)#39 | 4.2%(+57.3)#1,008 |
| 40. | 05678 | 61.5% | 40.9%(+20.6)#40 | 4.2%(+57.3)#1,016 |
| 41. | 05768 | 61.1% | 40.9%(+20.2)#41 | 4.2%(+56.9)#1,039 |
| 42. | 05161 | 60.9% | 40.9%(+20.0)#42 | 4.2%(+56.7)#1,049 |
| 43. | 05149 | 60.6% | 40.9%(+19.7)#43 | 4.2%(+56.4)#1,066 |
| 44. | 05902 | 60.0% | 40.9%(+19.1)#44 | 4.2%(+55.8)#1,107 |
| 45. | 05759 | 59.8% | 40.9%(+18.9)#45 | 4.2%(+55.6)#1,116 |
| 46. | 05640 | 59.6% | 40.9%(+18.7)#46 | 4.2%(+55.4)#1,141 |
| 47. | 05440 | 59.5% | 40.9%(+18.6)#47 | 4.2%(+55.3)#1,146 |
| 48. | 05252 | 59.3% | 40.9%(+18.4)#48 | 4.2%(+55.1)#1,163 |
| 49. | 05774 | 59.1% | 40.9%(+18.2)#49 | 4.2%(+54.9)#1,172 |
| 50. | 05903 | 59.0% | 40.9%(+18.1)#50 | 4.2%(+54.8)#1,182 |
| 51. | 05904 | 59.0% | 40.9%(+18.1)#51 | 4.2%(+54.8)#1,186 |
| 52. | 05850 | 58.7% | 40.9%(+17.8)#52 | 4.2%(+54.5)#1,201 |
| 53. | 05730 | 58.4% | 40.9%(+17.5)#53 | 4.2%(+54.2)#1,224 |
| 54. | 05846 | 58.2% | 40.9%(+17.3)#54 | 4.2%(+54.0)#1,237 |
| 55. | 05824 | 57.9% | 40.9%(+17.0)#55 | 4.2%(+53.7)#1,257 |
| 56. | 05860 | 57.8% | 40.9%(+16.9)#56 | 4.2%(+53.6)#1,264 |
| 57. | 05859 | 57.8% | 40.9%(+16.9)#57 | 4.2%(+53.6)#1,266 |
| 58. | 05341 | 57.8% | 40.9%(+16.9)#58 | 4.2%(+53.6)#1,271 |
| 59. | 05301 | 57.5% | 40.9%(+16.6)#59 | 4.2%(+53.3)#1,286 |
| 60. | 05352 | 57.4% | 40.9%(+16.5)#60 | 4.2%(+53.2)#1,292 |
| 61. | 05819 | 57.2% | 40.9%(+16.3)#61 | 4.2%(+53.0)#1,304 |
| 62. | 05763 | 57.0% | 40.9%(+16.1)#62 | 4.2%(+52.8)#1,316 |
| 63. | 05442 | 57.0% | 40.9%(+16.1)#63 | 4.2%(+52.8)#1,319 |
| 64. | 05733 | 56.9% | 40.9%(+16.0)#64 | 4.2%(+52.7)#1,324 |
| 65. | 05732 | 56.7% | 40.9%(+15.8)#65 | 4.2%(+52.5)#1,342 |
| 66. | 05822 | 56.5% | 40.9%(+15.6)#66 | 4.2%(+52.3)#1,357 |
| 67. | 05261 | 56.4% | 40.9%(+15.5)#67 | 4.2%(+52.2)#1,367 |
| 68. | 05362 | 56.4% | 40.9%(+15.5)#68 | 4.2%(+52.2)#1,372 |
| 69. | 05254 | 55.9% | 40.9%(+15.0)#69 | 4.2%(+51.7)#1,406 |
| 70. | 05907 | 55.9% | 40.9%(+15.0)#70 | 4.2%(+51.7)#1,409 |
| 71. | 05250 | 55.7% | 40.9%(+14.8)#71 | 4.2%(+51.5)#1,419 |
| 72. | 05342 | 55.3% | 40.9%(+14.4)#72 | 4.2%(+51.1)#1,454 |
| 73. | 05363 | 55.2% | 40.9%(+14.3)#73 | 4.2%(+51.0)#1,457 |
| 74. | 05734 | 55.0% | 40.9%(+14.1)#74 | 4.2%(+50.8)#1,483 |
| 75. | 05457 | 54.3% | 40.9%(+13.4)#75 | 4.2%(+50.1)#1,539 |
| 76. | 05075 | 54.1% | 40.9%(+13.2)#76 | 4.2%(+49.9)#1,550 |
| 77. | 05083 | 54.0% | 40.9%(+13.1)#77 | 4.2%(+49.8)#1,559 |
| 78. | 05651 | 53.6% | 40.9%(+12.7)#78 | 4.2%(+49.4)#1,587 |
| 79. | 05483 | 53.5% | 40.9%(+12.6)#79 | 4.2%(+49.3)#1,593 |
| 80. | 05769 | 53.3% | 40.9%(+12.4)#80 | 4.2%(+49.1)#1,606 |
| 81. | 05862 | 53.3% | 40.9%(+12.4)#81 | 4.2%(+49.1)#1,608 |
| 82. | 05089 | 53.1% | 40.9%(+12.2)#82 | 4.2%(+48.9)#1,613 |
| 83. | 05262 | 53.0% | 40.9%(+12.1)#83 | 4.2%(+48.8)#1,625 |
| 84. | 05679 | 52.8% | 40.9%(+11.9)#84 | 4.2%(+48.6)#1,643 |
| 85. | 05872 | 52.8% | 40.9%(+11.9)#85 | 4.2%(+48.6)#1,646 |
| 86. | 05441 | 52.8% | 40.9%(+11.9)#86 | 4.2%(+48.6)#1,649 |
| 87. | 05146 | 52.3% | 40.9%(+11.4)#87 | 4.2%(+48.1)#1,681 |
| 88. | 05836 | 52.1% | 40.9%(+11.2)#88 | 4.2%(+47.9)#1,698 |
| 89. | 05857 | 51.7% | 40.9%(+10.8)#89 | 4.2%(+47.5)#1,731 |
| 90. | 05602 | 51.1% | 40.9%(+10.2)#90 | 4.2%(+46.9)#1,762 |
| 91. | 05905 | 51.1% | 40.9%(+10.2)#91 | 4.2%(+46.9)#1,765 |
| 92. | 05758 | 50.9% | 40.9%(+10.0)#92 | 4.2%(+46.7)#1,777 |
| 93. | 05735 | 50.7% | 40.9%(+9.80)#93 | 4.2%(+46.5)#1,790 |
| 94. | 05463 | 50.7% | 40.9%(+9.80)#94 | 4.2%(+46.5)#1,793 |
| 95. | 05062 | 50.5% | 40.9%(+9.60)#95 | 4.2%(+46.3)#1,807 |
| 96. | 05906 | 50.4% | 40.9%(+9.50)#96 | 4.2%(+46.2)#1,813 |
| 97. | 05851 | 50.2% | 40.9%(+9.30)#97 | 4.2%(+46.0)#1,817 |
| 98. | 05142 | 50.0% | 40.9%(+9.10)#98 | 4.2%(+45.8)#1,836 |
| 99. | 05873 | 49.9% | 40.9%(+9.00)#99 | 4.2%(+45.7)#1,851 |
| 100. | 05770 | 49.7% | 40.9%(+8.80)#100 | 4.2%(+45.5)#1,863 |
Common Questions
What are the Top 10 Zip Codes with the Highest Percentage of Households Heated by Fuel Oil / Kerosene in Vermont?
Top 10 Zip Codes with the Highest Percentage of Households Heated by Fuel Oil / Kerosene in Vermont are:
What zip code has the Highest Percentage of Households Heated by Fuel Oil / Kerosene in Vermont?
05030 has the Highest Percentage of Households Heated by Fuel Oil / Kerosene in Vermont with 100.0%.
What is the Percentage of Households Heated by Fuel Oil / Kerosene in the State of Vermont?
Percentage of Households Heated by Fuel Oil / Kerosene in Vermont is 40.9%.
What is the Percentage of Households Heated by Fuel Oil / Kerosene in the United States?
Percentage of Households Heated by Fuel Oil / Kerosene in the United States is 4.2%.