Zip Codes with the Highest Percentage of Households Heated by Fuel Oil / Kerosene in Arkansas

RELATED REPORTS & OPTIONS

Fuel Oil Heating
Population
Families and Households
Female Fertility
Female Fertility (Unmarried)
Race (Community Size)
Race (Percentage)
Ancestry (Community Size)
AfghanAfricanAlaska NativeAlaskan AthabascanAlbanianAleutAlsatianAmericanApacheArabArapahoArgentineanArmenianAssyrian / Chaldean / SyriacAustralianAustrianBahamianBangladeshiBarbadianBasqueBelgianBelizeanBermudanBhutaneseBlackfeetBolivianBrazilianBritishBritish West IndianBulgarianBurmeseCajunCambodianCanadianCape VerdeanCarpatho RusynCelticCentral AmericanCentral American IndianCherokeeCheyenneChickasawChileanChineseChippewaChoctawColombianColvilleComancheCosta RicanCreeCreekCroatianCrowCubanCypriotCzechCzechoslovakianDanishDelawareDominicanDutchDutch West IndianEastern EuropeanEcuadorianEgyptianEnglishEstonianEthiopianEuropeanFijianFilipinoFinnishFrenchFrench American IndianFrench CanadianGermanGerman RussianGhanaianGreekGuamanian / ChamorroGuatemalanGuyaneseHaitianHmongHonduranHopiHoumaHungarianIcelanderIndian (Asian)IndonesianInupiatIranianIraqiIrishIroquoisIsraeliItalianJamaicanJapaneseJordanianKenyanKiowaKoreanLaotianLatvianLebaneseLiberianLithuanianLumbeeLuxembourgerMacedonianMalaysianMalteseMarshalleseMenomineeMexicanMexican American IndianMongolianMoroccanNative HawaiianNavajoNepaleseNew ZealanderNicaraguanNigerianNorthern EuropeanNorwegianOkinawanOsageOttawaPaiutePakistaniPalestinianPanamanianParaguayanPennsylvania GermanPeruvianPimaPolishPortuguesePotawatomiPuebloPuerto RicanPuget Sound SalishRomanianRussianSalvadoranSamoanScandinavianScotch-IrishScottishSeminoleSenegaleseSerbianShoshoneSierra LeoneanSiouxSlavicSlovakSloveneSomaliSouth AfricanSouth AmericanSouth American IndianSoviet UnionSpaniardSpanishSpanish AmericanSpanish American IndianSri LankanSubsaharan AfricanSudaneseSwedishSwissSyrianTaiwaneseThaiTlingit-HaidaTohono O'OdhamTonganTrinidadian and TobagonianTsimshianTurkishU.S. Virgin IslanderUgandanUkrainianUruguayanUteVenezuelanVietnameseWelshWest IndianYakamaYaquiYugoslavianYumanYup'ikZimbabwean
Ancestry (Percentage)
AfghanAfricanAlaska NativeAlaskan AthabascanAlbanianAleutAlsatianAmericanApacheArabArapahoArgentineanArmenianAssyrian / Chaldean / SyriacAustralianAustrianBahamianBangladeshiBarbadianBasqueBelgianBelizeanBermudanBhutaneseBlackfeetBolivianBrazilianBritishBritish West IndianBulgarianBurmeseCajunCambodianCanadianCape VerdeanCarpatho RusynCelticCentral AmericanCentral American IndianCherokeeCheyenneChickasawChileanChineseChippewaChoctawColombianColvilleComancheCosta RicanCreeCreekCroatianCrowCubanCypriotCzechCzechoslovakianDanishDelawareDominicanDutchDutch West IndianEastern EuropeanEcuadorianEgyptianEnglishEstonianEthiopianEuropeanFijianFilipinoFinnishFrenchFrench American IndianFrench CanadianGermanGerman RussianGhanaianGreekGuamanian / ChamorroGuatemalanGuyaneseHaitianHmongHonduranHopiHoumaHungarianIcelanderIndian (Asian)IndonesianInupiatIranianIraqiIrishIroquoisIsraeliItalianJamaicanJapaneseJordanianKenyanKiowaKoreanLaotianLatvianLebaneseLiberianLithuanianLumbeeLuxembourgerMacedonianMalaysianMalteseMarshalleseMenomineeMexicanMexican American IndianMongolianMoroccanNative HawaiianNavajoNepaleseNew ZealanderNicaraguanNigerianNorthern EuropeanNorwegianOkinawanOsageOttawaPaiutePakistaniPalestinianPanamanianParaguayanPennsylvania GermanPeruvianPimaPolishPortuguesePotawatomiPuebloPuerto RicanPuget Sound SalishRomanianRussianSalvadoranSamoanScandinavianScotch-IrishScottishSeminoleSenegaleseSerbianShoshoneSierra LeoneanSiouxSlavicSlovakSloveneSomaliSouth AfricanSouth AmericanSouth American IndianSoviet UnionSpaniardSpanishSpanish AmericanSpanish American IndianSri LankanSubsaharan AfricanSudaneseSwedishSwissSyrianTaiwaneseThaiTlingit-HaidaTohono O'OdhamTonganTrinidadian and TobagonianTsimshianTurkishU.S. Virgin IslanderUgandanUkrainianUruguayanUteVenezuelanVietnameseWelshWest IndianYakamaYaquiYugoslavianYumanYup'ikZimbabwean
Immigrant Origin (Total)
AfghanistanAfricaAlbaniaArgentinaArmeniaAsiaAustraliaAustriaAzoresBahamasBangladeshBarbadosBelarusBelgiumBelizeBoliviaBosnia and HerzegovinaBrazilBulgariaBurma / MyanmarCabo VerdeCambodiaCameroonCanadaCaribbeanCentral AmericaChileChinaColombiaCongoCosta RicaCroatiaCubaCzechoslovakiaDenmarkDominicaDominican RepublicEastern AfricaEastern AsiaEastern EuropeEcuadorEgyptEl SalvadorEnglandEritreaEthiopiaEuropeFijiFranceGermanyGhanaGreeceGrenadaGuatemalaGuyanaHaitiHondurasHong KongHungaryIndiaIndonesiaIranIraqIrelandIsraelItalyJamaicaJapanJordanKazakhstanKenyaKoreaKuwaitLaosLatin AmericaLatviaLebanonLiberiaLithuaniaMalaysiaMexicoMicronesiaMiddle AfricaMoldovaMoroccoNepalNetherlandsNicaraguaNigeriaNorth MacedoniaNorthern AfricaNorthern EuropeNorwayOceaniaPakistanPanamaPeruPhilippinesPolandPortugalRomaniaRussiaSaudi ArabiaScotlandSenegalSerbiaSierra LeoneSingaporeSomaliaSouth AfricaSouth AmericaSouth Central AsiaSouth Eastern AsiaSouthern EuropeSpainSri LankaSt. Vincent and the GrenadinesSudanSwedenSwitzerlandSyriaTaiwanThailandTrinidad and TobagoTurkeyUgandaUkraineUruguayUzbekistanVenezuelaVietnamWest IndiesWestern AfricaWestern AsiaWestern EuropeYemenZaireZimbabwe
Immigrant Origin (Percentage)
AfghanistanAfricaAlbaniaArgentinaArmeniaAsiaAustraliaAustriaAzoresBahamasBangladeshBarbadosBelarusBelgiumBelizeBoliviaBosnia and HerzegovinaBrazilBulgariaBurma / MyanmarCabo VerdeCambodiaCameroonCanadaCaribbeanCentral AmericaChileChinaColombiaCongoCosta RicaCroatiaCubaCzechoslovakiaDenmarkDominicaDominican RepublicEastern AfricaEastern AsiaEastern EuropeEcuadorEgyptEl SalvadorEnglandEritreaEthiopiaEuropeFijiFranceGermanyGhanaGreeceGrenadaGuatemalaGuyanaHaitiHondurasHong KongHungaryIndiaIndonesiaIranIraqIrelandIsraelItalyJamaicaJapanJordanKazakhstanKenyaKoreaKuwaitLaosLatin AmericaLatviaLebanonLiberiaLithuaniaMalaysiaMexicoMicronesiaMiddle AfricaMoldovaMoroccoNepalNetherlandsNicaraguaNigeriaNorth MacedoniaNorthern AfricaNorthern EuropeNorwayOceaniaPakistanPanamaPeruPhilippinesPolandPortugalRomaniaRussiaSaudi ArabiaScotlandSenegalSerbiaSierra LeoneSingaporeSomaliaSouth AfricaSouth AmericaSouth Central AsiaSouth Eastern AsiaSouthern EuropeSpainSri LankaSt. Vincent and the GrenadinesSudanSwedenSwitzerlandSyriaTaiwanThailandTrinidad and TobagoTurkeyUgandaUkraineUruguayUzbekistanVenezuelaVietnamWest IndiesWestern AfricaWestern AsiaWestern EuropeYemenZaireZimbabwe
Income
Income (Families)
Income (Households)
Poverty
Poverty (Families)
Unemployment
Employment Occupations
Employment Industries
Employer Class
Commute Time
Commute Means
School Enrollment
Education by Degree Field
Occupancy
Finances
Physical Characteristics
Arkansas
Compare Zip Codes
Comparison Subject

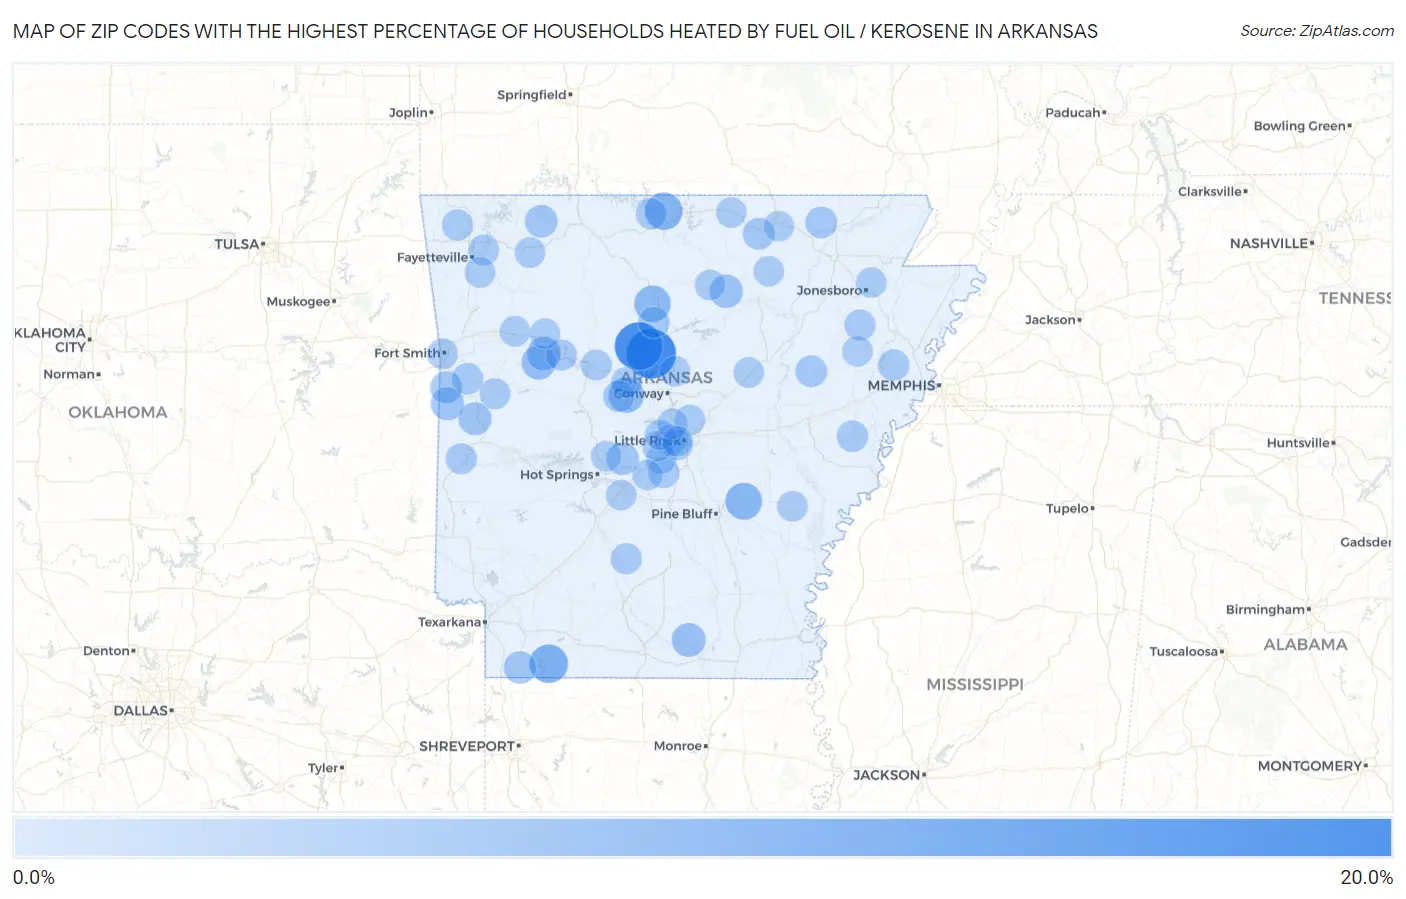
Map of Zip Codes with the Highest Percentage of Households Heated by Fuel Oil / Kerosene in Arkansas

0.0%
20.0%
Zip Codes with the Highest Percentage of Households Heated by Fuel Oil / Kerosene in Arkansas Map

Zip Codes with the Highest Percentage of Households Heated by Fuel Oil / Kerosene in Arkansas

Zip Code Fuel Oil Heating vs State vs National
1.7202715.2%0.10%(+15.1)#14.2%(+11.0)#4,963
2.7203013.9%0.10%(+13.8)#24.2%(+9.70)#5,201
3.718616.3%0.10%(+6.20)#34.2%(+2.10)#7,446
4.726515.5%0.10%(+5.40)#44.2%(+1.30)#7,860
5.720045.0%0.10%(+4.90)#54.2%(+0.800)#8,142
6.726294.7%0.10%(+4.60)#64.2%(+0.500)#8,347
7.721254.1%0.10%(+4.00)#74.2%(-0.100)#8,769
8.728653.0%0.10%(+2.90)#84.2%(-1.20)#9,727
9.728632.7%0.10%(+2.60)#94.2%(-1.50)#10,038
10.716512.7%0.10%(+2.60)#104.2%(-1.50)#10,089
11.725672.3%0.10%(+2.20)#114.2%(-1.90)#10,574
12.729382.2%0.10%(+2.10)#124.2%(-2.00)#10,693
13.729581.9%0.10%(+1.80)#134.2%(-2.30)#11,077
14.726161.7%0.10%(+1.60)#144.2%(-2.50)#11,384
15.720871.7%0.10%(+1.60)#154.2%(-2.50)#11,455
16.718261.6%0.10%(+1.50)#164.2%(-2.60)#11,638
17.729371.3%0.10%(+1.20)#174.2%(-2.90)#12,155
18.724551.1%0.10%(+1.00)#184.2%(-3.10)#12,510
19.725131.1%0.10%(+1.00)#194.2%(-3.10)#12,599
20.721011.0%0.10%(+0.900)#204.2%(-3.20)#12,835
21.729360.80%0.10%(+0.700)#214.2%(-3.40)#13,323
22.720310.80%0.10%(+0.700)#224.2%(-3.40)#13,374
23.723600.80%0.10%(+0.700)#234.2%(-3.40)#13,394
24.723310.70%0.10%(+0.600)#244.2%(-3.50)#13,794
25.720010.70%0.10%(+0.600)#254.2%(-3.50)#13,859
26.727130.60%0.10%(+0.500)#264.2%(-3.60)#13,960
27.719530.50%0.10%(+0.400)#274.2%(-3.70)#14,469
28.724320.50%0.10%(+0.400)#284.2%(-3.70)#14,545
29.720110.50%0.10%(+0.400)#294.2%(-3.70)#14,570
30.726190.50%0.10%(+0.400)#304.2%(-3.70)#14,645
31.717630.50%0.10%(+0.400)#314.2%(-3.70)#14,649
32.728450.50%0.10%(+0.400)#324.2%(-3.70)#14,677
33.729270.40%0.10%(+0.300)#334.2%(-3.80)#15,020
34.727030.30%0.10%(+0.200)#344.2%(-3.90)#15,310
35.722110.30%0.10%(+0.200)#354.2%(-3.90)#15,438
36.728020.30%0.10%(+0.200)#364.2%(-3.90)#15,448
37.729010.30%0.10%(+0.200)#374.2%(-3.90)#15,474
38.727010.20%0.10%(+0.100)#384.2%(-4.00)#15,926
39.719090.20%0.10%(+0.100)#394.2%(-4.00)#16,299
40.720220.20%0.10%(+0.100)#404.2%(-4.00)#16,312
41.722100.20%0.10%(+0.100)#414.2%(-4.00)#16,395
42.721100.20%0.10%(+0.100)#424.2%(-4.00)#16,447
43.727400.20%0.10%(+0.100)#434.2%(-4.00)#16,469
44.729490.20%0.10%(+0.100)#444.2%(-4.00)#16,471
45.723240.20%0.10%(+0.100)#454.2%(-4.00)#16,602
46.724010.10%0.10%(=0.000)#464.2%(-4.10)#16,930
47.721430.10%0.10%(=0.000)#474.2%(-4.10)#17,083
48.721200.10%0.10%(=0.000)#484.2%(-4.10)#17,123
49.722040.10%0.10%(=0.000)#494.2%(-4.10)#17,186
50.720150.10%0.10%(=0.000)#504.2%(-4.10)#17,267
51.722230.10%0.10%(=0.000)#514.2%(-4.10)#17,290
52.721130.10%0.10%(=0.000)#524.2%(-4.10)#17,294
53.721040.10%0.10%(=0.000)#534.2%(-4.10)#17,369
54.722050.10%0.10%(=0.000)#544.2%(-4.10)#17,415
55.720580.10%0.10%(=0.000)#554.2%(-4.10)#17,504
56.728300.10%0.10%(=0.000)#564.2%(-4.10)#17,536
57.725600.10%0.10%(=0.000)#574.2%(-4.10)#17,650
58.725210.10%0.10%(=0.000)#584.2%(-4.10)#17,678
59.720420.10%0.10%(=0.000)#594.2%(-4.10)#17,685
60.725420.10%0.10%(=0.000)#604.2%(-4.10)#17,709
61.725760.10%0.10%(=0.000)#614.2%(-4.10)#17,713

Common Questions

What are the Top 10 Zip Codes with the Highest Percentage of Households Heated by Fuel Oil / Kerosene in Arkansas?
Top 10 Zip Codes with the Highest Percentage of Households Heated by Fuel Oil / Kerosene in Arkansas are:
#1
15.2%
#2
13.9%
#3
6.3%
#4
5.5%
#5
5.0%
#6
4.7%
#7
4.1%
#8
3.0%
#9
2.7%
#10
2.7%
What zip code has the Highest Percentage of Households Heated by Fuel Oil / Kerosene in Arkansas?
72027 has the Highest Percentage of Households Heated by Fuel Oil / Kerosene in Arkansas with 15.2%.
What is the Percentage of Households Heated by Fuel Oil / Kerosene in the State of Arkansas?
Percentage of Households Heated by Fuel Oil / Kerosene in Arkansas is 0.10%.
What is the Percentage of Households Heated by Fuel Oil / Kerosene in the United States?
Percentage of Households Heated by Fuel Oil / Kerosene in the United States is 4.2%.