Zip Codes with the Highest Percentage of Households Heated by Fuel Oil / Kerosene in North Dakota
RELATED REPORTS & OPTIONS
Fuel Oil Heating
North Dakota
Compare Zip Codes
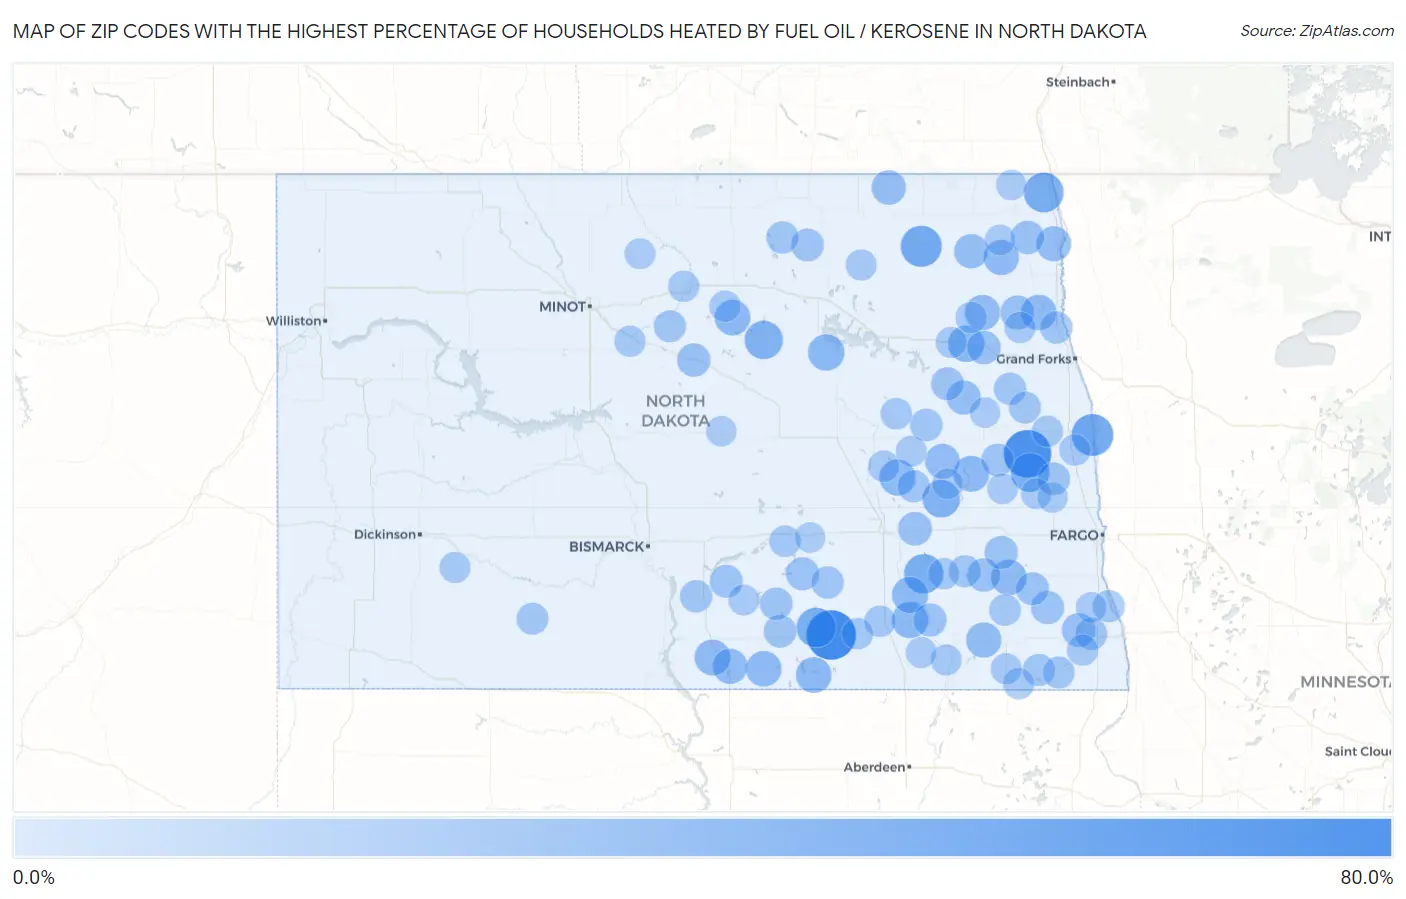
Map of Zip Codes with the Highest Percentage of Households Heated by Fuel Oil / Kerosene in North Dakota
0.0%
80.0%
Zip Codes with the Highest Percentage of Households Heated by Fuel Oil / Kerosene in North Dakota
| Zip Code | Fuel Oil Heating | vs State | vs National | |
| 1. | 58440 | 63.6% | 2.0%(+61.6)#1 | 4.2%(+59.4)#881 |
| 2. | 58016 | 57.8% | 2.0%(+55.8)#2 | 4.2%(+53.6)#1,273 |
| 3. | 58219 | 41.0% | 2.0%(+39.0)#3 | 4.2%(+36.8)#2,493 |
| 4. | 58355 | 38.9% | 2.0%(+36.9)#4 | 4.2%(+34.7)#2,652 |
| 5. | 58271 | 35.3% | 2.0%(+33.3)#5 | 4.2%(+31.1)#2,925 |
| 6. | 58460 | 34.5% | 2.0%(+32.5)#6 | 4.2%(+30.3)#3,006 |
| 7. | 58466 | 34.1% | 2.0%(+32.1)#7 | 4.2%(+29.9)#3,033 |
| 8. | 58035 | 32.5% | 2.0%(+30.5)#8 | 4.2%(+28.3)#3,140 |
| 9. | 58332 | 30.8% | 2.0%(+28.8)#9 | 4.2%(+26.6)#3,278 |
| 10. | 58479 | 29.1% | 2.0%(+27.1)#10 | 4.2%(+24.9)#3,409 |
| 11. | 58272 | 25.9% | 2.0%(+23.9)#11 | 4.2%(+21.7)#3,685 |
| 12. | 58357 | 25.7% | 2.0%(+23.7)#12 | 4.2%(+21.5)#3,703 |
| 13. | 58415 | 25.4% | 2.0%(+23.4)#13 | 4.2%(+21.2)#3,741 |
| 14. | 58426 | 25.4% | 2.0%(+23.4)#14 | 4.2%(+21.2)#3,742 |
| 15. | 58431 | 25.0% | 2.0%(+23.0)#15 | 4.2%(+20.8)#3,783 |
| 16. | 58056 | 24.3% | 2.0%(+22.3)#16 | 4.2%(+20.1)#3,840 |
| 17. | 58313 | 24.0% | 2.0%(+22.0)#17 | 4.2%(+19.8)#3,867 |
| 18. | 58573 | 23.8% | 2.0%(+21.8)#18 | 4.2%(+19.6)#3,884 |
| 19. | 58413 | 23.7% | 2.0%(+21.7)#19 | 4.2%(+19.5)#3,899 |
| 20. | 58027 | 23.5% | 2.0%(+21.5)#20 | 4.2%(+19.3)#3,920 |
| 21. | 58581 | 23.3% | 2.0%(+21.3)#21 | 4.2%(+19.1)#3,948 |
| 22. | 58261 | 23.0% | 2.0%(+21.0)#22 | 4.2%(+18.8)#3,978 |
| 23. | 58243 | 22.7% | 2.0%(+20.7)#23 | 4.2%(+18.5)#4,004 |
| 24. | 58231 | 22.5% | 2.0%(+20.5)#24 | 4.2%(+18.3)#4,027 |
| 25. | 58069 | 22.4% | 2.0%(+20.4)#25 | 4.2%(+18.2)#4,031 |
| 26. | 58542 | 22.3% | 2.0%(+20.3)#26 | 4.2%(+18.1)#4,041 |
| 27. | 58225 | 21.4% | 2.0%(+19.4)#27 | 4.2%(+17.2)#4,135 |
| 28. | 58448 | 21.3% | 2.0%(+19.3)#28 | 4.2%(+17.1)#4,146 |
| 29. | 58239 | 20.0% | 2.0%(+18.0)#29 | 4.2%(+15.8)#4,294 |
| 30. | 58227 | 19.7% | 2.0%(+17.7)#30 | 4.2%(+15.5)#4,329 |
| 31. | 58212 | 19.3% | 2.0%(+17.3)#31 | 4.2%(+15.1)#4,368 |
| 32. | 58233 | 18.7% | 2.0%(+16.7)#32 | 4.2%(+14.5)#4,432 |
| 33. | 58008 | 18.2% | 2.0%(+16.2)#33 | 4.2%(+14.0)#4,489 |
| 34. | 58266 | 18.0% | 2.0%(+16.0)#34 | 4.2%(+13.8)#4,524 |
| 35. | 58481 | 17.9% | 2.0%(+15.9)#35 | 4.2%(+13.7)#4,541 |
| 36. | 58276 | 17.5% | 2.0%(+15.5)#36 | 4.2%(+13.3)#4,595 |
| 37. | 58736 | 17.2% | 2.0%(+15.2)#37 | 4.2%(+13.0)#4,646 |
| 38. | 58062 | 17.1% | 2.0%(+15.1)#38 | 4.2%(+12.9)#4,665 |
| 39. | 58031 | 16.9% | 2.0%(+14.9)#39 | 4.2%(+12.7)#4,693 |
| 40. | 58057 | 16.9% | 2.0%(+14.9)#40 | 4.2%(+12.7)#4,694 |
| 41. | 58483 | 16.5% | 2.0%(+14.5)#41 | 4.2%(+12.3)#4,761 |
| 42. | 58458 | 16.4% | 2.0%(+14.4)#42 | 4.2%(+12.2)#4,775 |
| 43. | 58524 | 16.1% | 2.0%(+14.1)#43 | 4.2%(+11.9)#4,822 |
| 44. | 58068 | 16.0% | 2.0%(+14.0)#44 | 4.2%(+11.8)#4,839 |
| 45. | 58254 | 15.9% | 2.0%(+13.9)#45 | 4.2%(+11.7)#4,854 |
| 46. | 58046 | 15.5% | 2.0%(+13.5)#46 | 4.2%(+11.3)#4,921 |
| 47. | 58495 | 15.4% | 2.0%(+13.4)#47 | 4.2%(+11.2)#4,934 |
| 48. | 58317 | 15.1% | 2.0%(+13.1)#48 | 4.2%(+10.9)#4,984 |
| 49. | 58561 | 14.9% | 2.0%(+12.9)#49 | 4.2%(+10.7)#5,014 |
| 50. | 58048 | 14.9% | 2.0%(+12.9)#50 | 4.2%(+10.7)#5,018 |
| 51. | 58256 | 14.7% | 2.0%(+12.7)#51 | 4.2%(+10.5)#5,054 |
| 52. | 58544 | 14.6% | 2.0%(+12.6)#52 | 4.2%(+10.4)#5,076 |
| 53. | 58442 | 14.6% | 2.0%(+12.6)#53 | 4.2%(+10.4)#5,077 |
| 54. | 58416 | 14.6% | 2.0%(+12.6)#54 | 4.2%(+10.4)#5,078 |
| 55. | 58353 | 14.6% | 2.0%(+12.6)#55 | 4.2%(+10.4)#5,082 |
| 56. | 58267 | 14.3% | 2.0%(+12.3)#56 | 4.2%(+10.1)#5,125 |
| 57. | 58492 | 14.0% | 2.0%(+12.0)#57 | 4.2%(+9.80)#5,186 |
| 58. | 58061 | 14.0% | 2.0%(+12.0)#58 | 4.2%(+9.80)#5,187 |
| 59. | 58049 | 13.5% | 2.0%(+11.5)#59 | 4.2%(+9.30)#5,267 |
| 60. | 58240 | 13.3% | 2.0%(+11.3)#60 | 4.2%(+9.10)#5,286 |
| 61. | 58001 | 13.3% | 2.0%(+11.3)#61 | 4.2%(+9.10)#5,293 |
| 62. | 58744 | 13.3% | 2.0%(+11.3)#62 | 4.2%(+9.10)#5,296 |
| 63. | 58013 | 13.1% | 2.0%(+11.1)#63 | 4.2%(+8.90)#5,335 |
| 64. | 58053 | 12.9% | 2.0%(+10.9)#64 | 4.2%(+8.70)#5,373 |
| 65. | 58533 | 12.8% | 2.0%(+10.8)#65 | 4.2%(+8.60)#5,396 |
| 66. | 58054 | 12.1% | 2.0%(+10.1)#66 | 4.2%(+7.90)#5,545 |
| 67. | 58487 | 11.9% | 2.0%(+9.90)#67 | 4.2%(+7.70)#5,602 |
| 68. | 58433 | 11.7% | 2.0%(+9.70)#68 | 4.2%(+7.50)#5,651 |
| 69. | 58456 | 11.7% | 2.0%(+9.70)#69 | 4.2%(+7.50)#5,656 |
| 70. | 58464 | 11.6% | 2.0%(+9.60)#70 | 4.2%(+7.40)#5,690 |
| 71. | 58043 | 11.5% | 2.0%(+9.50)#71 | 4.2%(+7.30)#5,713 |
| 72. | 58224 | 11.5% | 2.0%(+9.50)#72 | 4.2%(+7.30)#5,714 |
| 73. | 58368 | 11.4% | 2.0%(+9.40)#73 | 4.2%(+7.20)#5,721 |
| 74. | 58788 | 11.4% | 2.0%(+9.40)#74 | 4.2%(+7.20)#5,725 |
| 75. | 58455 | 11.4% | 2.0%(+9.40)#75 | 4.2%(+7.20)#5,728 |
| 76. | 58045 | 11.3% | 2.0%(+9.30)#76 | 4.2%(+7.10)#5,738 |
| 77. | 58235 | 11.3% | 2.0%(+9.30)#77 | 4.2%(+7.10)#5,748 |
| 78. | 58257 | 11.2% | 2.0%(+9.20)#78 | 4.2%(+7.00)#5,772 |
| 79. | 58058 | 11.1% | 2.0%(+9.10)#79 | 4.2%(+6.90)#5,808 |
| 80. | 58790 | 10.9% | 2.0%(+8.90)#80 | 4.2%(+6.70)#5,852 |
| 81. | 58461 | 10.8% | 2.0%(+8.80)#81 | 4.2%(+6.60)#5,876 |
| 82. | 58259 | 10.7% | 2.0%(+8.70)#82 | 4.2%(+6.50)#5,902 |
| 83. | 58641 | 10.7% | 2.0%(+8.70)#83 | 4.2%(+6.50)#5,908 |
| 84. | 58032 | 10.6% | 2.0%(+8.60)#84 | 4.2%(+6.40)#5,933 |
| 85. | 58474 | 10.5% | 2.0%(+8.50)#85 | 4.2%(+6.30)#5,943 |
| 86. | 58377 | 10.5% | 2.0%(+8.50)#86 | 4.2%(+6.30)#5,953 |
| 87. | 58441 | 10.4% | 2.0%(+8.40)#87 | 4.2%(+6.20)#5,981 |
| 88. | 58484 | 10.3% | 2.0%(+8.30)#88 | 4.2%(+6.10)#5,999 |
| 89. | 58789 | 10.2% | 2.0%(+8.20)#89 | 4.2%(+6.00)#6,029 |
| 90. | 58549 | 10.2% | 2.0%(+8.20)#90 | 4.2%(+6.00)#6,033 |
| 91. | 58064 | 9.9% | 2.0%(+7.90)#91 | 4.2%(+5.70)#6,104 |
| 92. | 58018 | 9.7% | 2.0%(+7.70)#92 | 4.2%(+5.50)#6,160 |
| 93. | 58029 | 9.7% | 2.0%(+7.70)#93 | 4.2%(+5.50)#6,163 |
| 94. | 58429 | 9.6% | 2.0%(+7.60)#94 | 4.2%(+5.40)#6,196 |
| 95. | 58222 | 9.6% | 2.0%(+7.60)#95 | 4.2%(+5.40)#6,197 |
| 96. | 58444 | 9.3% | 2.0%(+7.30)#96 | 4.2%(+5.10)#6,282 |
| 97. | 58277 | 9.2% | 2.0%(+7.20)#97 | 4.2%(+5.00)#6,314 |
| 98. | 58467 | 9.1% | 2.0%(+7.10)#98 | 4.2%(+4.90)#6,340 |
| 99. | 58006 | 8.9% | 2.0%(+6.90)#99 | 4.2%(+4.70)#6,396 |
| 100. | 58265 | 8.8% | 2.0%(+6.80)#100 | 4.2%(+4.60)#6,437 |
Common Questions
What are the Top 10 Zip Codes with the Highest Percentage of Households Heated by Fuel Oil / Kerosene in North Dakota?
Top 10 Zip Codes with the Highest Percentage of Households Heated by Fuel Oil / Kerosene in North Dakota are:
What zip code has the Highest Percentage of Households Heated by Fuel Oil / Kerosene in North Dakota?
58440 has the Highest Percentage of Households Heated by Fuel Oil / Kerosene in North Dakota with 63.6%.
What is the Percentage of Households Heated by Fuel Oil / Kerosene in the State of North Dakota?
Percentage of Households Heated by Fuel Oil / Kerosene in North Dakota is 2.0%.
What is the Percentage of Households Heated by Fuel Oil / Kerosene in the United States?
Percentage of Households Heated by Fuel Oil / Kerosene in the United States is 4.2%.