Zip Codes with the Highest Percentage of Households Heated by Fuel Oil / Kerosene in New Mexico

RELATED REPORTS & OPTIONS

Fuel Oil Heating
Population
Families and Households
Female Fertility
Female Fertility (Unmarried)
Race (Community Size)
Race (Percentage)
Ancestry (Community Size)
AfghanAfricanAlaska NativeAlaskan AthabascanAlbanianAleutAlsatianAmericanApacheArabArapahoArgentineanArmenianAssyrian / Chaldean / SyriacAustralianAustrianBahamianBangladeshiBarbadianBasqueBelgianBelizeanBermudanBhutaneseBlackfeetBolivianBrazilianBritishBritish West IndianBulgarianBurmeseCajunCambodianCanadianCape VerdeanCarpatho RusynCelticCentral AmericanCentral American IndianCherokeeCheyenneChickasawChileanChineseChippewaChoctawColombianColvilleComancheCosta RicanCreeCreekCroatianCrowCubanCypriotCzechCzechoslovakianDanishDelawareDominicanDutchDutch West IndianEastern EuropeanEcuadorianEgyptianEnglishEstonianEthiopianEuropeanFijianFilipinoFinnishFrenchFrench American IndianFrench CanadianGermanGerman RussianGhanaianGreekGuamanian / ChamorroGuatemalanGuyaneseHaitianHmongHonduranHopiHoumaHungarianIcelanderIndian (Asian)IndonesianInupiatIranianIraqiIrishIroquoisIsraeliItalianJamaicanJapaneseJordanianKenyanKiowaKoreanLaotianLatvianLebaneseLiberianLithuanianLumbeeLuxembourgerMacedonianMalaysianMalteseMarshalleseMenomineeMexicanMexican American IndianMongolianMoroccanNative HawaiianNavajoNepaleseNew ZealanderNicaraguanNigerianNorthern EuropeanNorwegianOkinawanOsageOttawaPaiutePakistaniPalestinianPanamanianParaguayanPennsylvania GermanPeruvianPimaPolishPortuguesePotawatomiPuebloPuerto RicanPuget Sound SalishRomanianRussianSalvadoranSamoanScandinavianScotch-IrishScottishSeminoleSenegaleseSerbianShoshoneSierra LeoneanSiouxSlavicSlovakSloveneSomaliSouth AfricanSouth AmericanSouth American IndianSoviet UnionSpaniardSpanishSpanish AmericanSpanish American IndianSri LankanSubsaharan AfricanSudaneseSwedishSwissSyrianTaiwaneseThaiTlingit-HaidaTohono O'OdhamTonganTrinidadian and TobagonianTsimshianTurkishU.S. Virgin IslanderUgandanUkrainianUruguayanUteVenezuelanVietnameseWelshWest IndianYakamaYaquiYugoslavianYumanYup'ikZimbabwean
Ancestry (Percentage)
AfghanAfricanAlaska NativeAlaskan AthabascanAlbanianAleutAlsatianAmericanApacheArabArapahoArgentineanArmenianAssyrian / Chaldean / SyriacAustralianAustrianBahamianBangladeshiBarbadianBasqueBelgianBelizeanBermudanBhutaneseBlackfeetBolivianBrazilianBritishBritish West IndianBulgarianBurmeseCajunCambodianCanadianCape VerdeanCarpatho RusynCelticCentral AmericanCentral American IndianCherokeeCheyenneChickasawChileanChineseChippewaChoctawColombianColvilleComancheCosta RicanCreeCreekCroatianCrowCubanCypriotCzechCzechoslovakianDanishDelawareDominicanDutchDutch West IndianEastern EuropeanEcuadorianEgyptianEnglishEstonianEthiopianEuropeanFijianFilipinoFinnishFrenchFrench American IndianFrench CanadianGermanGerman RussianGhanaianGreekGuamanian / ChamorroGuatemalanGuyaneseHaitianHmongHonduranHopiHoumaHungarianIcelanderIndian (Asian)IndonesianInupiatIranianIraqiIrishIroquoisIsraeliItalianJamaicanJapaneseJordanianKenyanKiowaKoreanLaotianLatvianLebaneseLiberianLithuanianLumbeeLuxembourgerMacedonianMalaysianMalteseMarshalleseMenomineeMexicanMexican American IndianMongolianMoroccanNative HawaiianNavajoNepaleseNew ZealanderNicaraguanNigerianNorthern EuropeanNorwegianOkinawanOsageOttawaPaiutePakistaniPalestinianPanamanianParaguayanPennsylvania GermanPeruvianPimaPolishPortuguesePotawatomiPuebloPuerto RicanPuget Sound SalishRomanianRussianSalvadoranSamoanScandinavianScotch-IrishScottishSeminoleSenegaleseSerbianShoshoneSierra LeoneanSiouxSlavicSlovakSloveneSomaliSouth AfricanSouth AmericanSouth American IndianSoviet UnionSpaniardSpanishSpanish AmericanSpanish American IndianSri LankanSubsaharan AfricanSudaneseSwedishSwissSyrianTaiwaneseThaiTlingit-HaidaTohono O'OdhamTonganTrinidadian and TobagonianTsimshianTurkishU.S. Virgin IslanderUgandanUkrainianUruguayanUteVenezuelanVietnameseWelshWest IndianYakamaYaquiYugoslavianYumanYup'ikZimbabwean
Immigrant Origin (Total)
AfghanistanAfricaAlbaniaArgentinaArmeniaAsiaAustraliaAustriaAzoresBahamasBangladeshBarbadosBelarusBelgiumBelizeBoliviaBosnia and HerzegovinaBrazilBulgariaBurma / MyanmarCabo VerdeCambodiaCameroonCanadaCaribbeanCentral AmericaChileChinaColombiaCongoCosta RicaCroatiaCubaCzechoslovakiaDenmarkDominicaDominican RepublicEastern AfricaEastern AsiaEastern EuropeEcuadorEgyptEl SalvadorEnglandEritreaEthiopiaEuropeFijiFranceGermanyGhanaGreeceGrenadaGuatemalaGuyanaHaitiHondurasHong KongHungaryIndiaIndonesiaIranIraqIrelandIsraelItalyJamaicaJapanJordanKazakhstanKenyaKoreaKuwaitLaosLatin AmericaLatviaLebanonLiberiaLithuaniaMalaysiaMexicoMicronesiaMiddle AfricaMoldovaMoroccoNepalNetherlandsNicaraguaNigeriaNorth MacedoniaNorthern AfricaNorthern EuropeNorwayOceaniaPakistanPanamaPeruPhilippinesPolandPortugalRomaniaRussiaSaudi ArabiaScotlandSenegalSerbiaSierra LeoneSingaporeSomaliaSouth AfricaSouth AmericaSouth Central AsiaSouth Eastern AsiaSouthern EuropeSpainSri LankaSt. Vincent and the GrenadinesSudanSwedenSwitzerlandSyriaTaiwanThailandTrinidad and TobagoTurkeyUgandaUkraineUruguayUzbekistanVenezuelaVietnamWest IndiesWestern AfricaWestern AsiaWestern EuropeYemenZaireZimbabwe
Immigrant Origin (Percentage)
AfghanistanAfricaAlbaniaArgentinaArmeniaAsiaAustraliaAustriaAzoresBahamasBangladeshBarbadosBelarusBelgiumBelizeBoliviaBosnia and HerzegovinaBrazilBulgariaBurma / MyanmarCabo VerdeCambodiaCameroonCanadaCaribbeanCentral AmericaChileChinaColombiaCongoCosta RicaCroatiaCubaCzechoslovakiaDenmarkDominicaDominican RepublicEastern AfricaEastern AsiaEastern EuropeEcuadorEgyptEl SalvadorEnglandEritreaEthiopiaEuropeFijiFranceGermanyGhanaGreeceGrenadaGuatemalaGuyanaHaitiHondurasHong KongHungaryIndiaIndonesiaIranIraqIrelandIsraelItalyJamaicaJapanJordanKazakhstanKenyaKoreaKuwaitLaosLatin AmericaLatviaLebanonLiberiaLithuaniaMalaysiaMexicoMicronesiaMiddle AfricaMoldovaMoroccoNepalNetherlandsNicaraguaNigeriaNorth MacedoniaNorthern AfricaNorthern EuropeNorwayOceaniaPakistanPanamaPeruPhilippinesPolandPortugalRomaniaRussiaSaudi ArabiaScotlandSenegalSerbiaSierra LeoneSingaporeSomaliaSouth AfricaSouth AmericaSouth Central AsiaSouth Eastern AsiaSouthern EuropeSpainSri LankaSt. Vincent and the GrenadinesSudanSwedenSwitzerlandSyriaTaiwanThailandTrinidad and TobagoTurkeyUgandaUkraineUruguayUzbekistanVenezuelaVietnamWest IndiesWestern AfricaWestern AsiaWestern EuropeYemenZaireZimbabwe
Income
Income (Families)
Income (Households)
Poverty
Poverty (Families)
Unemployment
Employment Occupations
Employment Industries
Employer Class
Commute Time
Commute Means
School Enrollment
Education by Degree Field
Occupancy
Finances
Physical Characteristics
New Mexico
Compare Zip Codes
Comparison Subject

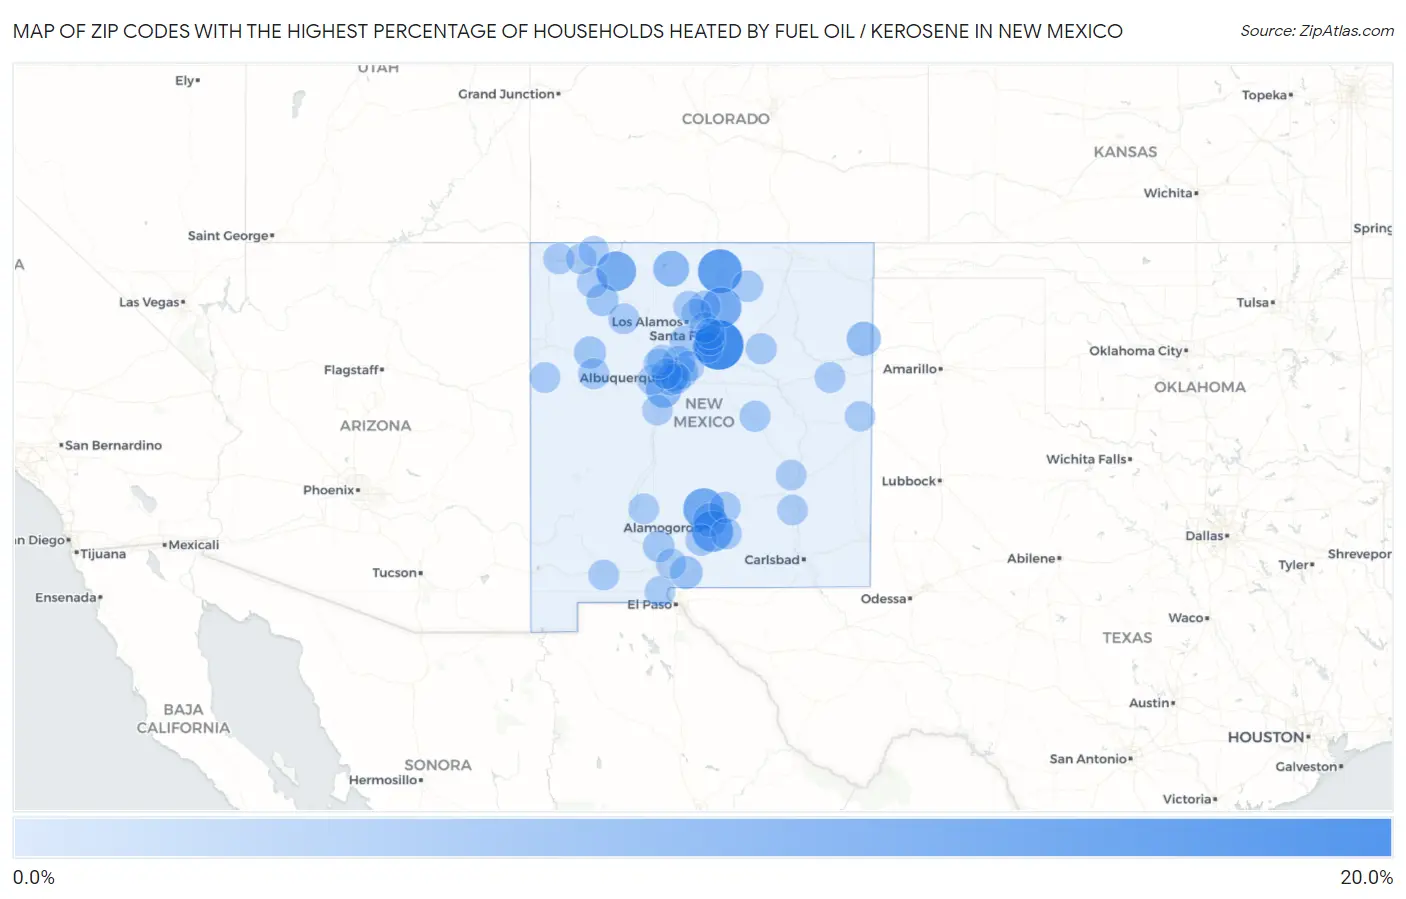
Map of Zip Codes with the Highest Percentage of Households Heated by Fuel Oil / Kerosene in New Mexico

0.0%
20.0%
Zip Codes with the Highest Percentage of Households Heated by Fuel Oil / Kerosene in New Mexico Map

Zip Codes with the Highest Percentage of Households Heated by Fuel Oil / Kerosene in New Mexico

Zip Code Fuel Oil Heating vs State vs National
1.8753516.6%0.20%(+16.4)#14.2%(+12.4)#4,745
2.8751311.8%0.20%(+11.6)#24.2%(+7.60)#5,628
3.883529.1%0.20%(+8.90)#34.2%(+4.90)#6,328
4.883259.1%0.20%(+8.90)#44.2%(+4.90)#6,333
5.875218.5%0.20%(+8.30)#54.2%(+4.30)#6,529
6.874128.0%0.20%(+7.80)#64.2%(+3.80)#6,710
7.875754.7%0.20%(+4.50)#74.2%(+0.500)#8,338
8.870224.3%0.20%(+4.10)#84.2%(+0.100)#8,615
9.884303.3%0.20%(+3.10)#94.2%(-0.900)#9,473
10.883373.1%0.20%(+2.90)#104.2%(-1.10)#9,623
11.870082.3%0.20%(+2.10)#114.2%(-1.90)#10,520
12.880812.2%0.20%(+2.00)#124.2%(-2.00)#10,601
13.870432.0%0.20%(+1.80)#134.2%(-2.20)#10,936
14.870451.5%0.20%(+1.30)#144.2%(-2.70)#11,796
15.870371.4%0.20%(+1.20)#154.2%(-2.80)#11,991
16.880121.0%0.20%(+0.800)#164.2%(-3.20)#12,704
17.883100.90%0.20%(+0.700)#174.2%(-3.30)#12,953
18.883400.90%0.20%(+0.700)#184.2%(-3.30)#13,103
19.877100.90%0.20%(+0.700)#194.2%(-3.30)#13,171
20.875110.80%0.20%(+0.600)#204.2%(-3.40)#13,445
21.877010.60%0.20%(+0.400)#214.2%(-3.60)#14,004
22.870200.60%0.20%(+0.400)#224.2%(-3.60)#14,056
23.871160.60%0.20%(+0.400)#234.2%(-3.60)#14,136
24.883170.60%0.20%(+0.400)#244.2%(-3.60)#14,190
25.870410.60%0.20%(+0.400)#254.2%(-3.60)#14,239
26.883530.60%0.20%(+0.400)#264.2%(-3.60)#14,252
27.874130.50%0.20%(+0.300)#274.2%(-3.70)#14,453
28.875080.40%0.20%(+0.200)#284.2%(-3.80)#14,909
29.870470.40%0.20%(+0.200)#294.2%(-3.80)#15,065
30.875370.40%0.20%(+0.200)#304.2%(-3.80)#15,110
31.874210.40%0.20%(+0.200)#314.2%(-3.80)#15,144
32.874010.30%0.20%(+0.100)#324.2%(-3.90)#15,251
33.871120.30%0.20%(+0.100)#334.2%(-3.90)#15,267
34.880300.30%0.20%(+0.100)#344.2%(-3.90)#15,432
35.873270.30%0.20%(+0.100)#354.2%(-3.90)#15,658
36.884010.30%0.20%(+0.100)#364.2%(-3.90)#15,689
37.870130.30%0.20%(+0.100)#374.2%(-3.90)#15,703
38.871210.20%0.20%(=0.000)#384.2%(-4.00)#15,843
39.871440.20%0.20%(=0.000)#394.2%(-4.00)#15,921
40.871230.20%0.20%(=0.000)#404.2%(-4.00)#15,966
41.875050.20%0.20%(=0.000)#414.2%(-4.00)#16,089
42.882030.20%0.20%(=0.000)#424.2%(-4.00)#16,129
43.871070.20%0.20%(=0.000)#434.2%(-4.00)#16,154
44.882010.20%0.20%(=0.000)#444.2%(-4.00)#16,178
45.880210.20%0.20%(=0.000)#454.2%(-4.00)#16,353
46.875060.20%0.20%(=0.000)#464.2%(-4.00)#16,359
47.879010.20%0.20%(=0.000)#474.2%(-4.00)#16,519
48.871240.10%0.20%(-0.100)#484.2%(-4.10)#16,739
49.881010.10%0.20%(-0.100)#494.2%(-4.10)#16,881
50.880110.10%0.20%(-0.100)#504.2%(-4.10)#17,172
51.870020.10%0.20%(-0.100)#514.2%(-4.10)#17,465
52.875320.10%0.20%(-0.100)#524.2%(-4.10)#17,469
53.874100.10%0.20%(-0.100)#534.2%(-4.10)#17,562
54.875010.10%0.20%(-0.100)#544.2%(-4.10)#17,563

Common Questions

What are the Top 10 Zip Codes with the Highest Percentage of Households Heated by Fuel Oil / Kerosene in New Mexico?
Top 10 Zip Codes with the Highest Percentage of Households Heated by Fuel Oil / Kerosene in New Mexico are:
#1
16.6%
#2
11.8%
#3
9.1%
#4
9.1%
#5
8.5%
#6
8.0%
#7
4.7%
#8
4.3%
#9
3.3%
#10
3.1%
What zip code has the Highest Percentage of Households Heated by Fuel Oil / Kerosene in New Mexico?
87535 has the Highest Percentage of Households Heated by Fuel Oil / Kerosene in New Mexico with 16.6%.
What is the Percentage of Households Heated by Fuel Oil / Kerosene in the State of New Mexico?
Percentage of Households Heated by Fuel Oil / Kerosene in New Mexico is 0.20%.
What is the Percentage of Households Heated by Fuel Oil / Kerosene in the United States?
Percentage of Households Heated by Fuel Oil / Kerosene in the United States is 4.2%.