Zip Codes with the Highest Percentage of Households Heated by Fuel Oil / Kerosene in South Carolina
RELATED REPORTS & OPTIONS
Fuel Oil Heating
South Carolina
Compare Zip Codes
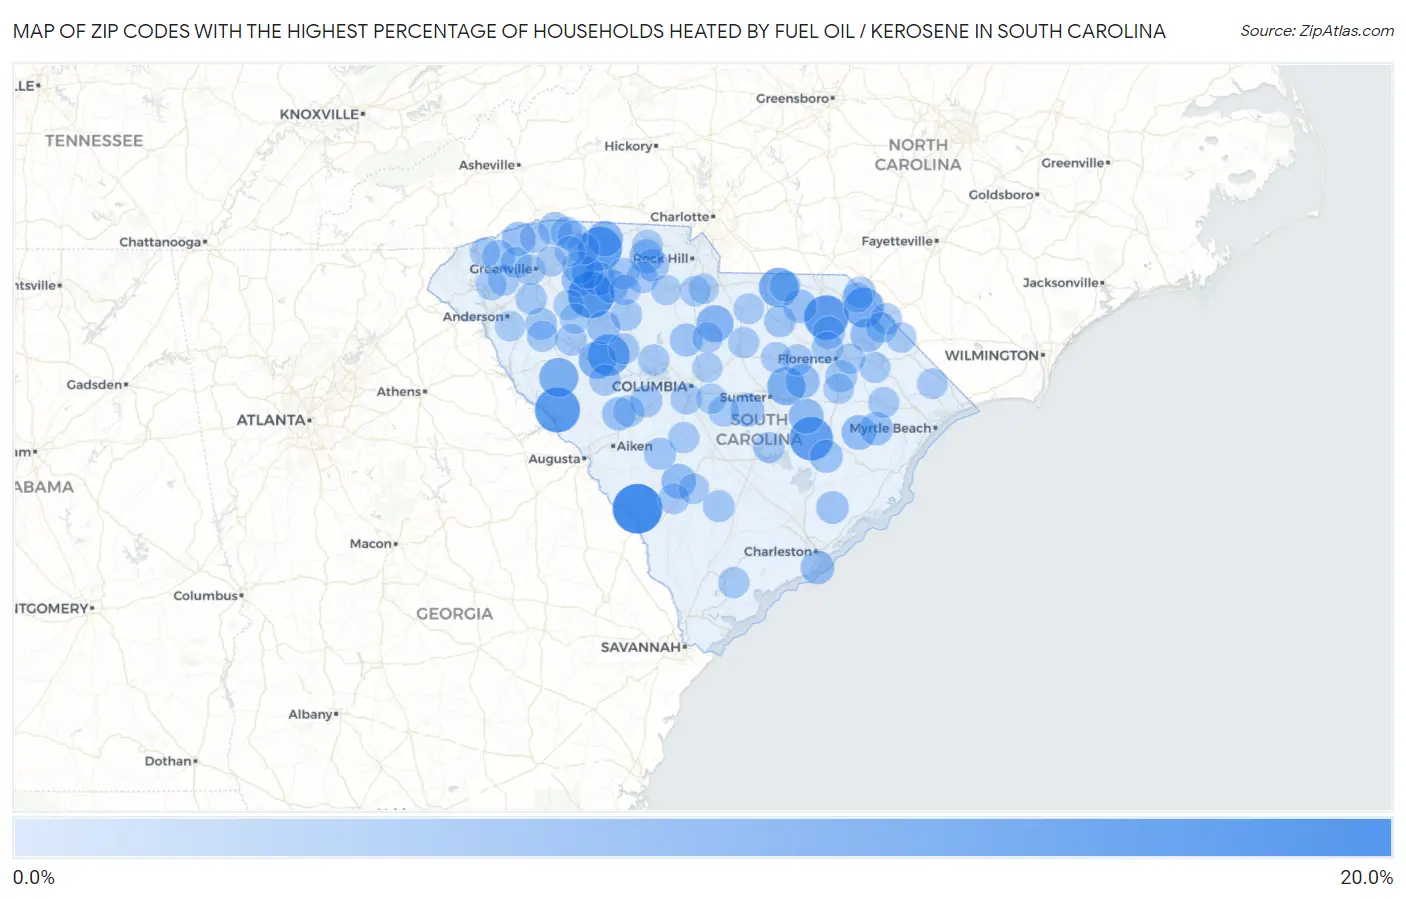
Map of Zip Codes with the Highest Percentage of Households Heated by Fuel Oil / Kerosene in South Carolina
0.0%
20.0%
Zip Codes with the Highest Percentage of Households Heated by Fuel Oil / Kerosene in South Carolina
| Zip Code | Fuel Oil Heating | vs State | vs National | |
| 1. | 29836 | 17.3% | 0.60%(+16.7)#1 | 4.2%(+13.1)#4,631 |
| 2. | 29335 | 14.5% | 0.60%(+13.9)#2 | 4.2%(+10.3)#5,087 |
| 3. | 29845 | 13.5% | 0.60%(+12.9)#3 | 4.2%(+9.30)#5,263 |
| 4. | 29593 | 12.8% | 0.60%(+12.2)#4 | 4.2%(+8.60)#5,391 |
| 5. | 29329 | 12.5% | 0.60%(+11.9)#5 | 4.2%(+8.30)#5,475 |
| 6. | 29056 | 12.2% | 0.60%(+11.6)#6 | 4.2%(+8.00)#5,529 |
| 7. | 29145 | 10.4% | 0.60%(+9.80)#7 | 4.2%(+6.20)#5,978 |
| 8. | 29525 | 9.3% | 0.60%(+8.70)#8 | 4.2%(+5.10)#6,270 |
| 9. | 29727 | 8.8% | 0.60%(+8.20)#9 | 4.2%(+4.60)#6,426 |
| 10. | 29819 | 8.4% | 0.60%(+7.80)#10 | 4.2%(+4.20)#6,556 |
| 11. | 29104 | 7.5% | 0.60%(+6.90)#11 | 4.2%(+3.30)#6,930 |
| 12. | 29037 | 7.2% | 0.60%(+6.60)#12 | 4.2%(+3.00)#7,042 |
| 13. | 29074 | 6.7% | 0.60%(+6.10)#13 | 4.2%(+2.50)#7,276 |
| 14. | 29330 | 5.6% | 0.60%(+5.00)#14 | 4.2%(+1.40)#7,783 |
| 15. | 29111 | 5.0% | 0.60%(+4.40)#15 | 4.2%(+0.800)#8,138 |
| 16. | 29042 | 4.8% | 0.60%(+4.20)#16 | 4.2%(+0.600)#8,243 |
| 17. | 29580 | 4.6% | 0.60%(+4.00)#17 | 4.2%(+0.400)#8,409 |
| 18. | 29565 | 4.5% | 0.60%(+3.90)#18 | 4.2%(+0.300)#8,450 |
| 19. | 29080 | 4.3% | 0.60%(+3.70)#19 | 4.2%(+0.100)#8,583 |
| 20. | 29388 | 4.2% | 0.60%(+3.60)#20 | 4.2%(=0.000)#8,640 |
| 21. | 29717 | 4.1% | 0.60%(+3.50)#21 | 4.2%(-0.100)#8,756 |
| 22. | 29661 | 4.0% | 0.60%(+3.40)#22 | 4.2%(-0.200)#8,809 |
| 23. | 29374 | 4.0% | 0.60%(+3.40)#23 | 4.2%(-0.200)#8,822 |
| 24. | 29439 | 4.0% | 0.60%(+3.40)#24 | 4.2%(-0.200)#8,843 |
| 25. | 29321 | 3.9% | 0.60%(+3.30)#25 | 4.2%(-0.300)#8,878 |
| 26. | 29168 | 3.8% | 0.60%(+3.20)#26 | 4.2%(-0.400)#8,968 |
| 27. | 29554 | 3.7% | 0.60%(+3.10)#27 | 4.2%(-0.500)#9,050 |
| 28. | 29584 | 3.7% | 0.60%(+3.10)#28 | 4.2%(-0.500)#9,073 |
| 29. | 29129 | 3.6% | 0.60%(+3.00)#29 | 4.2%(-0.600)#9,135 |
| 30. | 29351 | 3.6% | 0.60%(+3.00)#30 | 4.2%(-0.600)#9,161 |
| 31. | 29356 | 3.5% | 0.60%(+2.90)#31 | 4.2%(-0.700)#9,218 |
| 32. | 29564 | 3.4% | 0.60%(+2.80)#32 | 4.2%(-0.800)#9,360 |
| 33. | 29180 | 3.3% | 0.60%(+2.70)#33 | 4.2%(-0.900)#9,402 |
| 34. | 29671 | 3.1% | 0.60%(+2.50)#34 | 4.2%(-1.10)#9,575 |
| 35. | 29369 | 3.1% | 0.60%(+2.50)#35 | 4.2%(-1.10)#9,579 |
| 36. | 29742 | 3.1% | 0.60%(+2.50)#36 | 4.2%(-1.10)#9,617 |
| 37. | 29450 | 3.0% | 0.60%(+2.40)#37 | 4.2%(-1.20)#9,705 |
| 38. | 29376 | 2.9% | 0.60%(+2.30)#38 | 4.2%(-1.30)#9,781 |
| 39. | 29070 | 2.7% | 0.60%(+2.10)#39 | 4.2%(-1.50)#9,985 |
| 40. | 29540 | 2.7% | 0.60%(+2.10)#40 | 4.2%(-1.50)#10,012 |
| 41. | 29146 | 2.7% | 0.60%(+2.10)#41 | 4.2%(-1.50)#10,050 |
| 42. | 29541 | 2.5% | 0.60%(+1.90)#42 | 4.2%(-1.70)#10,224 |
| 43. | 29101 | 2.5% | 0.60%(+1.90)#43 | 4.2%(-1.70)#10,260 |
| 44. | 29654 | 2.3% | 0.60%(+1.70)#44 | 4.2%(-1.90)#10,481 |
| 45. | 29481 | 2.3% | 0.60%(+1.70)#45 | 4.2%(-1.90)#10,536 |
| 46. | 29303 | 2.2% | 0.60%(+1.60)#46 | 4.2%(-2.00)#10,594 |
| 47. | 29532 | 2.2% | 0.60%(+1.60)#47 | 4.2%(-2.00)#10,599 |
| 48. | 29570 | 2.2% | 0.60%(+1.60)#48 | 4.2%(-2.00)#10,649 |
| 49. | 29178 | 2.2% | 0.60%(+1.60)#49 | 4.2%(-2.00)#10,654 |
| 50. | 29105 | 2.2% | 0.60%(+1.60)#50 | 4.2%(-2.00)#10,687 |
| 51. | 29364 | 2.2% | 0.60%(+1.60)#51 | 4.2%(-2.00)#10,711 |
| 52. | 29669 | 2.1% | 0.60%(+1.50)#52 | 4.2%(-2.10)#10,757 |
| 53. | 29353 | 2.1% | 0.60%(+1.50)#53 | 4.2%(-2.10)#10,792 |
| 54. | 29657 | 2.0% | 0.60%(+1.40)#54 | 4.2%(-2.20)#10,899 |
| 55. | 29322 | 2.0% | 0.60%(+1.40)#55 | 4.2%(-2.20)#10,912 |
| 56. | 29172 | 2.0% | 0.60%(+1.40)#56 | 4.2%(-2.20)#10,916 |
| 57. | 29384 | 2.0% | 0.60%(+1.40)#57 | 4.2%(-2.20)#10,940 |
| 58. | 29547 | 2.0% | 0.60%(+1.40)#58 | 4.2%(-2.20)#10,958 |
| 59. | 29138 | 1.9% | 0.60%(+1.30)#59 | 4.2%(-2.30)#11,057 |
| 60. | 29069 | 1.9% | 0.60%(+1.30)#60 | 4.2%(-2.30)#11,091 |
| 61. | 29112 | 1.9% | 0.60%(+1.30)#61 | 4.2%(-2.30)#11,097 |
| 62. | 29075 | 1.9% | 0.60%(+1.30)#62 | 4.2%(-2.30)#11,104 |
| 63. | 29640 | 1.8% | 0.60%(+1.20)#63 | 4.2%(-2.40)#11,210 |
| 64. | 29020 | 1.8% | 0.60%(+1.20)#64 | 4.2%(-2.40)#11,220 |
| 65. | 29148 | 1.8% | 0.60%(+1.20)#65 | 4.2%(-2.40)#11,255 |
| 66. | 29940 | 1.8% | 0.60%(+1.20)#66 | 4.2%(-2.40)#11,271 |
| 67. | 29108 | 1.7% | 0.60%(+1.10)#67 | 4.2%(-2.50)#11,367 |
| 68. | 29638 | 1.7% | 0.60%(+1.10)#68 | 4.2%(-2.50)#11,419 |
| 69. | 29546 | 1.7% | 0.60%(+1.10)#69 | 4.2%(-2.50)#11,434 |
| 70. | 29843 | 1.7% | 0.60%(+1.10)#70 | 4.2%(-2.50)#11,469 |
| 71. | 29536 | 1.6% | 0.60%(+1.000)#71 | 4.2%(-2.60)#11,526 |
| 72. | 29571 | 1.6% | 0.60%(+1.000)#72 | 4.2%(-2.60)#11,532 |
| 73. | 29052 | 1.6% | 0.60%(+1.000)#73 | 4.2%(-2.60)#11,598 |
| 74. | 29741 | 1.6% | 0.60%(+1.000)#74 | 4.2%(-2.60)#11,619 |
| 75. | 29611 | 1.5% | 0.60%(+0.900)#75 | 4.2%(-2.70)#11,696 |
| 76. | 29690 | 1.5% | 0.60%(+0.900)#76 | 4.2%(-2.70)#11,708 |
| 77. | 29379 | 1.5% | 0.60%(+0.900)#77 | 4.2%(-2.70)#11,721 |
| 78. | 29130 | 1.5% | 0.60%(+0.900)#78 | 4.2%(-2.70)#11,755 |
| 79. | 29743 | 1.5% | 0.60%(+0.900)#79 | 4.2%(-2.70)#11,801 |
| 80. | 29569 | 1.4% | 0.60%(+0.800)#80 | 4.2%(-2.80)#11,891 |
| 81. | 29630 | 1.4% | 0.60%(+0.800)#81 | 4.2%(-2.80)#11,894 |
| 82. | 29010 | 1.4% | 0.60%(+0.800)#82 | 4.2%(-2.80)#11,912 |
| 83. | 29067 | 1.4% | 0.60%(+0.800)#83 | 4.2%(-2.80)#11,917 |
| 84. | 29003 | 1.4% | 0.60%(+0.800)#84 | 4.2%(-2.80)#11,943 |
| 85. | 29349 | 1.3% | 0.60%(+0.700)#85 | 4.2%(-2.90)#12,056 |
| 86. | 29061 | 1.3% | 0.60%(+0.700)#86 | 4.2%(-2.90)#12,096 |
| 87. | 29645 | 1.3% | 0.60%(+0.700)#87 | 4.2%(-2.90)#12,105 |
| 88. | 29385 | 1.3% | 0.60%(+0.700)#88 | 4.2%(-2.90)#12,116 |
| 89. | 29530 | 1.3% | 0.60%(+0.700)#89 | 4.2%(-2.90)#12,173 |
| 90. | 29729 | 1.3% | 0.60%(+0.700)#90 | 4.2%(-2.90)#12,185 |
| 91. | 29563 | 1.3% | 0.60%(+0.700)#91 | 4.2%(-2.90)#12,192 |
| 92. | 29594 | 1.3% | 0.60%(+0.700)#92 | 4.2%(-2.90)#12,253 |
| 93. | 29360 | 1.2% | 0.60%(+0.600)#93 | 4.2%(-3.00)#12,283 |
| 94. | 29506 | 1.2% | 0.60%(+0.600)#94 | 4.2%(-3.00)#12,288 |
| 95. | 29624 | 1.2% | 0.60%(+0.600)#95 | 4.2%(-3.00)#12,303 |
| 96. | 29714 | 1.2% | 0.60%(+0.600)#96 | 4.2%(-3.00)#12,367 |
| 97. | 29685 | 1.2% | 0.60%(+0.600)#97 | 4.2%(-3.00)#12,397 |
| 98. | 29229 | 1.1% | 0.60%(+0.500)#98 | 4.2%(-3.10)#12,454 |
| 99. | 29650 | 1.1% | 0.60%(+0.500)#99 | 4.2%(-3.10)#12,460 |
| 100. | 29706 | 1.1% | 0.60%(+0.500)#100 | 4.2%(-3.10)#12,491 |
Common Questions
What are the Top 10 Zip Codes with the Highest Percentage of Households Heated by Fuel Oil / Kerosene in South Carolina?
Top 10 Zip Codes with the Highest Percentage of Households Heated by Fuel Oil / Kerosene in South Carolina are:
What zip code has the Highest Percentage of Households Heated by Fuel Oil / Kerosene in South Carolina?
29836 has the Highest Percentage of Households Heated by Fuel Oil / Kerosene in South Carolina with 17.3%.
What is the Percentage of Households Heated by Fuel Oil / Kerosene in the State of South Carolina?
Percentage of Households Heated by Fuel Oil / Kerosene in South Carolina is 0.60%.
What is the Percentage of Households Heated by Fuel Oil / Kerosene in the United States?
Percentage of Households Heated by Fuel Oil / Kerosene in the United States is 4.2%.