Zip Codes with the Highest Percentage of Households Heated by Fuel Oil / Kerosene in Maine
RELATED REPORTS & OPTIONS
Fuel Oil Heating
Maine
Compare Zip Codes
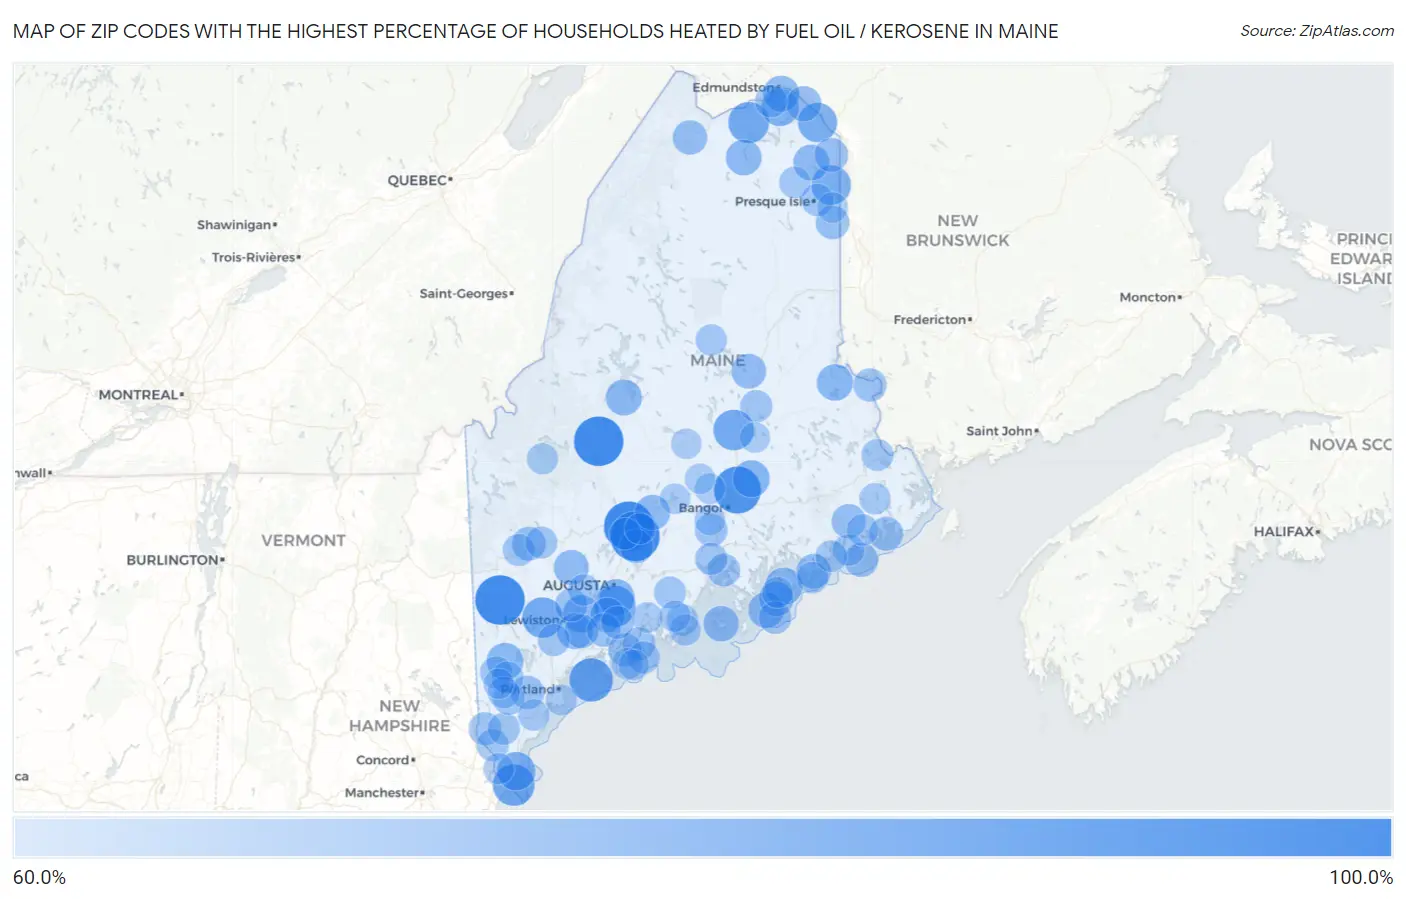
Map of Zip Codes with the Highest Percentage of Households Heated by Fuel Oil / Kerosene in Maine
60.0%
100.0%
Zip Codes with the Highest Percentage of Households Heated by Fuel Oil / Kerosene in Maine
| Zip Code | Fuel Oil Heating | vs State | vs National | |
| 1. | 04944 | 100.0% | 59.3%(+40.7)#1 | 4.2%(+95.8)#44 |
| 2. | 04975 | 100.0% | 59.3%(+40.7)#2 | 4.2%(+95.8)#62 |
| 3. | 04267 | 100.0% | 59.3%(+40.7)#3 | 4.2%(+95.8)#63 |
| 4. | 04925 | 100.0% | 59.3%(+40.7)#4 | 4.2%(+95.8)#90 |
| 5. | 04489 | 95.6% | 59.3%(+36.3)#5 | 4.2%(+91.4)#118 |
| 6. | 04003 | 89.7% | 59.3%(+30.4)#6 | 4.2%(+85.5)#162 |
| 7. | 03905 | 86.6% | 59.3%(+27.3)#7 | 4.2%(+82.4)#195 |
| 8. | 04359 | 85.9% | 59.3%(+26.6)#8 | 4.2%(+81.7)#199 |
| 9. | 04781 | 85.3% | 59.3%(+26.0)#9 | 4.2%(+81.1)#209 |
| 10. | 04448 | 84.8% | 59.3%(+25.5)#10 | 4.2%(+80.6)#214 |
| 11. | 04256 | 84.7% | 59.3%(+25.4)#11 | 4.2%(+80.5)#215 |
| 12. | 04742 | 82.8% | 59.3%(+23.5)#12 | 4.2%(+78.6)#224 |
| 13. | 04785 | 82.4% | 59.3%(+23.1)#13 | 4.2%(+78.2)#233 |
| 14. | 03911 | 81.2% | 59.3%(+21.9)#14 | 4.2%(+77.0)#247 |
| 15. | 04662 | 79.5% | 59.3%(+20.2)#15 | 4.2%(+75.3)#268 |
| 16. | 04772 | 79.4% | 59.3%(+20.1)#16 | 4.2%(+75.2)#271 |
| 17. | 04461 | 78.6% | 59.3%(+19.3)#17 | 4.2%(+74.4)#286 |
| 18. | 04280 | 78.5% | 59.3%(+19.2)#18 | 4.2%(+74.3)#289 |
| 19. | 04346 | 78.3% | 59.3%(+19.0)#19 | 4.2%(+74.1)#293 |
| 20. | 04091 | 78.1% | 59.3%(+18.8)#20 | 4.2%(+73.9)#296 |
| 21. | 04413 | 77.6% | 59.3%(+18.3)#21 | 4.2%(+73.4)#307 |
| 22. | 04756 | 77.3% | 59.3%(+18.0)#22 | 4.2%(+73.1)#312 |
| 23. | 04442 | 77.0% | 59.3%(+17.7)#23 | 4.2%(+72.8)#317 |
| 24. | 04250 | 76.9% | 59.3%(+17.6)#24 | 4.2%(+72.7)#318 |
| 25. | 04685 | 76.8% | 59.3%(+17.5)#25 | 4.2%(+72.6)#320 |
| 26. | 04739 | 76.7% | 59.3%(+17.4)#26 | 4.2%(+72.5)#321 |
| 27. | 04736 | 76.6% | 59.3%(+17.3)#27 | 4.2%(+72.4)#326 |
| 28. | 04863 | 76.0% | 59.3%(+16.7)#28 | 4.2%(+71.8)#338 |
| 29. | 04967 | 75.8% | 59.3%(+16.5)#29 | 4.2%(+71.6)#342 |
| 30. | 04746 | 75.6% | 59.3%(+16.3)#30 | 4.2%(+71.4)#349 |
| 31. | 04254 | 75.4% | 59.3%(+16.1)#31 | 4.2%(+71.2)#355 |
| 32. | 04430 | 75.0% | 59.3%(+15.7)#32 | 4.2%(+70.8)#365 |
| 33. | 04669 | 75.0% | 59.3%(+15.7)#33 | 4.2%(+70.8)#367 |
| 34. | 04357 | 74.8% | 59.3%(+15.5)#34 | 4.2%(+70.6)#369 |
| 35. | 04653 | 74.8% | 59.3%(+15.5)#35 | 4.2%(+70.6)#371 |
| 36. | 04743 | 74.4% | 59.3%(+15.1)#36 | 4.2%(+70.2)#376 |
| 37. | 04623 | 74.1% | 59.3%(+14.8)#37 | 4.2%(+69.9)#384 |
| 38. | 04655 | 73.7% | 59.3%(+14.4)#38 | 4.2%(+69.5)#394 |
| 39. | 04901 | 73.5% | 59.3%(+14.2)#39 | 4.2%(+69.3)#398 |
| 40. | 04611 | 73.5% | 59.3%(+14.2)#40 | 4.2%(+69.3)#401 |
| 41. | 04257 | 73.4% | 59.3%(+14.1)#41 | 4.2%(+69.2)#404 |
| 42. | 04252 | 73.3% | 59.3%(+14.0)#42 | 4.2%(+69.1)#409 |
| 43. | 04750 | 73.3% | 59.3%(+14.0)#43 | 4.2%(+69.1)#410 |
| 44. | 04758 | 73.1% | 59.3%(+13.8)#44 | 4.2%(+68.9)#420 |
| 45. | 04008 | 73.0% | 59.3%(+13.7)#45 | 4.2%(+68.8)#423 |
| 46. | 04093 | 72.9% | 59.3%(+13.6)#46 | 4.2%(+68.7)#424 |
| 47. | 04571 | 72.5% | 59.3%(+13.2)#47 | 4.2%(+68.3)#434 |
| 48. | 04491 | 72.4% | 59.3%(+13.1)#48 | 4.2%(+68.2)#439 |
| 49. | 04027 | 71.9% | 59.3%(+12.6)#49 | 4.2%(+67.7)#449 |
| 50. | 04573 | 71.9% | 59.3%(+12.6)#50 | 4.2%(+67.7)#450 |
| 51. | 04236 | 71.8% | 59.3%(+12.5)#51 | 4.2%(+67.6)#453 |
| 52. | 04342 | 71.8% | 59.3%(+12.5)#52 | 4.2%(+67.6)#454 |
| 53. | 04496 | 71.6% | 59.3%(+12.3)#53 | 4.2%(+67.4)#457 |
| 54. | 04421 | 71.5% | 59.3%(+12.2)#54 | 4.2%(+67.3)#459 |
| 55. | 04635 | 71.4% | 59.3%(+12.1)#55 | 4.2%(+67.2)#468 |
| 56. | 04745 | 71.0% | 59.3%(+11.7)#56 | 4.2%(+66.8)#474 |
| 57. | 04769 | 70.9% | 59.3%(+11.6)#57 | 4.2%(+66.7)#475 |
| 58. | 04457 | 70.9% | 59.3%(+11.6)#58 | 4.2%(+66.7)#476 |
| 59. | 04020 | 70.9% | 59.3%(+11.6)#59 | 4.2%(+66.7)#480 |
| 60. | 04554 | 70.9% | 59.3%(+11.6)#60 | 4.2%(+66.7)#481 |
| 61. | 03901 | 70.7% | 59.3%(+11.4)#61 | 4.2%(+66.5)#485 |
| 62. | 04974 | 70.7% | 59.3%(+11.4)#62 | 4.2%(+66.5)#487 |
| 63. | 04073 | 70.6% | 59.3%(+11.3)#63 | 4.2%(+66.4)#490 |
| 64. | 04260 | 70.5% | 59.3%(+11.2)#64 | 4.2%(+66.3)#494 |
| 65. | 04030 | 70.5% | 59.3%(+11.2)#65 | 4.2%(+66.3)#495 |
| 66. | 04276 | 70.4% | 59.3%(+11.1)#66 | 4.2%(+66.2)#498 |
| 67. | 04049 | 70.4% | 59.3%(+11.1)#67 | 4.2%(+66.2)#499 |
| 68. | 04862 | 70.3% | 59.3%(+11.0)#68 | 4.2%(+66.1)#505 |
| 69. | 04224 | 70.3% | 59.3%(+11.0)#69 | 4.2%(+66.1)#506 |
| 70. | 04937 | 70.2% | 59.3%(+10.9)#70 | 4.2%(+66.0)#511 |
| 71. | 04061 | 70.2% | 59.3%(+10.9)#71 | 4.2%(+66.0)#513 |
| 72. | 04694 | 70.2% | 59.3%(+10.9)#72 | 4.2%(+66.0)#514 |
| 73. | 04786 | 69.9% | 59.3%(+10.6)#73 | 4.2%(+65.7)#532 |
| 74. | 04606 | 69.8% | 59.3%(+10.5)#74 | 4.2%(+65.6)#535 |
| 75. | 04648 | 69.8% | 59.3%(+10.5)#75 | 4.2%(+65.6)#536 |
| 76. | 04613 | 69.8% | 59.3%(+10.5)#76 | 4.2%(+65.6)#538 |
| 77. | 04861 | 69.7% | 59.3%(+10.4)#77 | 4.2%(+65.5)#540 |
| 78. | 04658 | 69.7% | 59.3%(+10.4)#78 | 4.2%(+65.5)#542 |
| 79. | 04265 | 69.6% | 59.3%(+10.3)#79 | 4.2%(+65.4)#546 |
| 80. | 04576 | 69.6% | 59.3%(+10.3)#80 | 4.2%(+65.4)#548 |
| 81. | 04005 | 69.5% | 59.3%(+10.2)#81 | 4.2%(+65.3)#551 |
| 82. | 04462 | 69.4% | 59.3%(+10.1)#82 | 4.2%(+65.2)#554 |
| 83. | 04858 | 69.2% | 59.3%(+9.90)#83 | 4.2%(+65.0)#562 |
| 84. | 04630 | 69.1% | 59.3%(+9.80)#84 | 4.2%(+64.9)#565 |
| 85. | 04864 | 69.0% | 59.3%(+9.70)#85 | 4.2%(+64.8)#567 |
| 86. | 04982 | 69.0% | 59.3%(+9.70)#86 | 4.2%(+64.8)#570 |
| 87. | 04679 | 68.8% | 59.3%(+9.50)#87 | 4.2%(+64.6)#574 |
| 88. | 04107 | 68.6% | 59.3%(+9.30)#88 | 4.2%(+64.4)#581 |
| 89. | 04927 | 68.6% | 59.3%(+9.30)#89 | 4.2%(+64.4)#582 |
| 90. | 03903 | 68.5% | 59.3%(+9.20)#90 | 4.2%(+64.3)#589 |
| 91. | 04444 | 68.2% | 59.3%(+8.90)#91 | 4.2%(+64.0)#602 |
| 92. | 04953 | 68.0% | 59.3%(+8.70)#92 | 4.2%(+63.8)#610 |
| 93. | 04555 | 68.0% | 59.3%(+8.70)#93 | 4.2%(+63.8)#611 |
| 94. | 04450 | 68.0% | 59.3%(+8.70)#94 | 4.2%(+63.8)#612 |
| 95. | 04740 | 68.0% | 59.3%(+8.70)#95 | 4.2%(+63.8)#613 |
| 96. | 04544 | 67.9% | 59.3%(+8.60)#96 | 4.2%(+63.7)#619 |
| 97. | 04426 | 67.8% | 59.3%(+8.50)#97 | 4.2%(+63.6)#623 |
| 98. | 04427 | 67.8% | 59.3%(+8.50)#98 | 4.2%(+63.6)#624 |
| 99. | 04048 | 67.7% | 59.3%(+8.40)#99 | 4.2%(+63.5)#627 |
| 100. | 04493 | 67.7% | 59.3%(+8.40)#100 | 4.2%(+63.5)#628 |
Common Questions
What are the Top 10 Zip Codes with the Highest Percentage of Households Heated by Fuel Oil / Kerosene in Maine?
Top 10 Zip Codes with the Highest Percentage of Households Heated by Fuel Oil / Kerosene in Maine are:
What zip code has the Highest Percentage of Households Heated by Fuel Oil / Kerosene in Maine?
04944 has the Highest Percentage of Households Heated by Fuel Oil / Kerosene in Maine with 100.0%.
What is the Percentage of Households Heated by Fuel Oil / Kerosene in the State of Maine?
Percentage of Households Heated by Fuel Oil / Kerosene in Maine is 59.3%.
What is the Percentage of Households Heated by Fuel Oil / Kerosene in the United States?
Percentage of Households Heated by Fuel Oil / Kerosene in the United States is 4.2%.