Zip Codes with the Highest Percentage of Households Heated by Fuel Oil / Kerosene in Arizona
RELATED REPORTS & OPTIONS
Fuel Oil Heating
Arizona
Compare Zip Codes
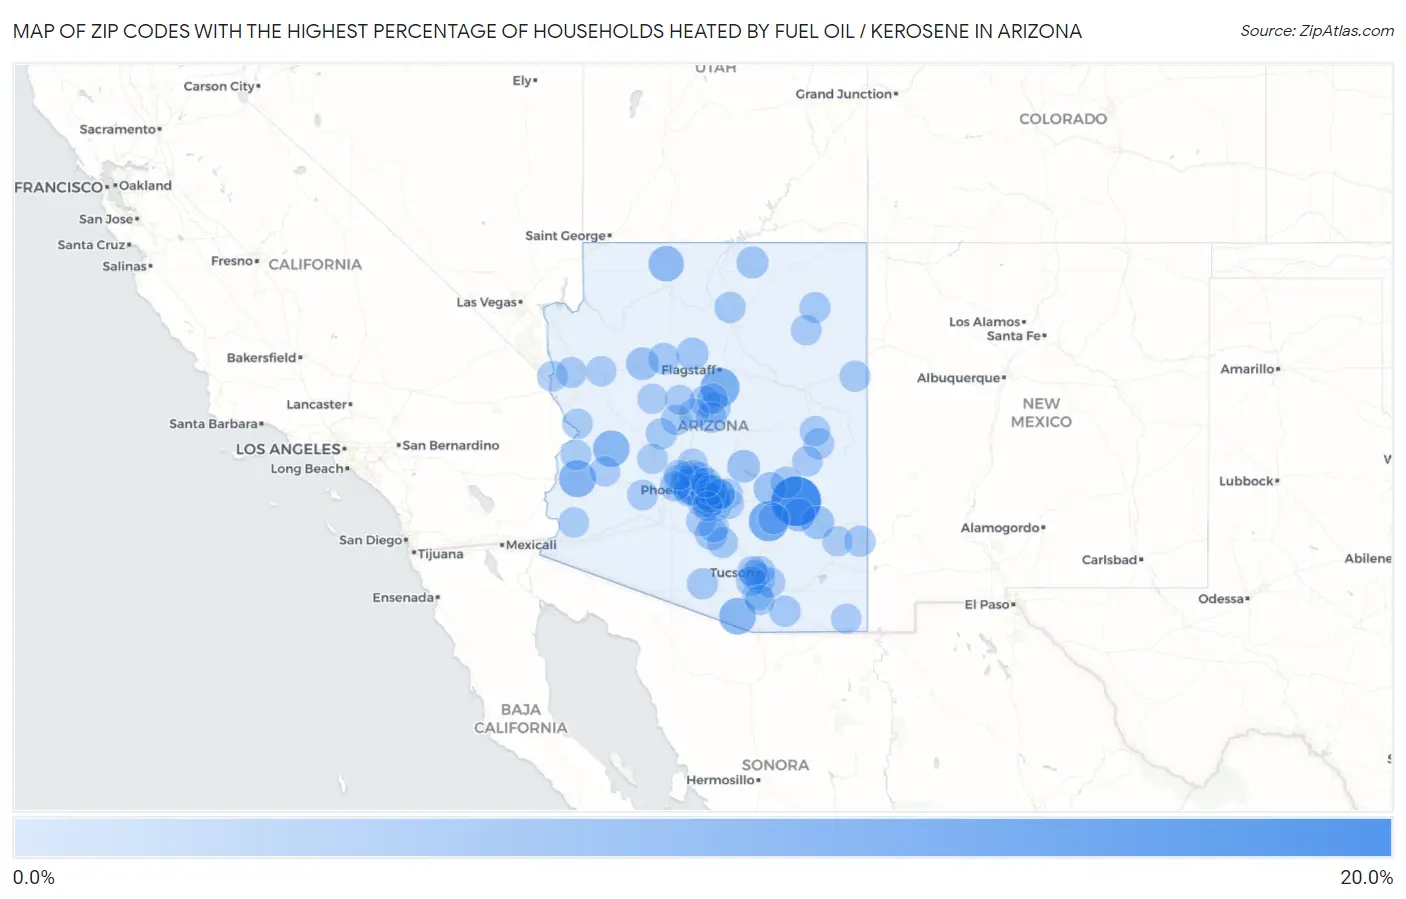
Map of Zip Codes with the Highest Percentage of Households Heated by Fuel Oil / Kerosene in Arizona
0.0%
20.0%
Zip Codes with the Highest Percentage of Households Heated by Fuel Oil / Kerosene in Arizona
| Zip Code | Fuel Oil Heating | vs State | vs National | |
| 1. | 85542 | 19.2% | 0.10%(+19.1)#1 | 4.2%(+15.0)#4,375 |
| 2. | 85135 | 9.4% | 0.10%(+9.30)#2 | 4.2%(+5.20)#6,252 |
| 3. | 86017 | 8.5% | 0.10%(+8.40)#3 | 4.2%(+4.30)#6,528 |
| 4. | 85346 | 6.5% | 0.10%(+6.40)#4 | 4.2%(+2.30)#7,342 |
| 5. | 85601 | 6.3% | 0.10%(+6.20)#5 | 4.2%(+2.10)#7,457 |
| 6. | 85357 | 6.2% | 0.10%(+6.10)#6 | 4.2%(+2.00)#7,509 |
| 7. | 86022 | 5.0% | 0.10%(+4.90)#7 | 4.2%(+0.800)#8,137 |
| 8. | 85543 | 2.9% | 0.10%(+2.80)#8 | 4.2%(-1.30)#9,798 |
| 9. | 85501 | 2.6% | 0.10%(+2.50)#9 | 4.2%(-1.60)#10,112 |
| 10. | 85530 | 2.6% | 0.10%(+2.50)#10 | 4.2%(-1.60)#10,160 |
| 11. | 86337 | 2.5% | 0.10%(+2.40)#11 | 4.2%(-1.70)#10,273 |
| 12. | 85553 | 2.5% | 0.10%(+2.40)#12 | 4.2%(-1.70)#10,276 |
| 13. | 85193 | 2.1% | 0.10%(+2.00)#13 | 4.2%(-2.10)#10,776 |
| 14. | 86046 | 2.0% | 0.10%(+1.90)#14 | 4.2%(-2.20)#10,925 |
| 15. | 86053 | 1.7% | 0.10%(+1.60)#15 | 4.2%(-2.50)#11,442 |
| 16. | 86320 | 1.4% | 0.10%(+1.30)#16 | 4.2%(-2.80)#11,975 |
| 17. | 85550 | 1.2% | 0.10%(+1.10)#17 | 4.2%(-3.00)#12,350 |
| 18. | 86335 | 1.1% | 0.10%(+1.00)#18 | 4.2%(-3.10)#12,570 |
| 19. | 85192 | 1.1% | 0.10%(+1.00)#19 | 4.2%(-3.10)#12,616 |
| 20. | 85611 | 1.1% | 0.10%(+1.00)#20 | 4.2%(-3.10)#12,640 |
| 21. | 86325 | 1.0% | 0.10%(+0.900)#21 | 4.2%(-3.20)#12,800 |
| 22. | 85534 | 1.0% | 0.10%(+0.900)#22 | 4.2%(-3.20)#12,841 |
| 23. | 86020 | 1.0% | 0.10%(+0.900)#23 | 4.2%(-3.20)#12,865 |
| 24. | 85634 | 0.90% | 0.10%(+0.800)#24 | 4.2%(-3.30)#13,075 |
| 25. | 86332 | 0.90% | 0.10%(+0.800)#25 | 4.2%(-3.30)#13,143 |
| 26. | 86520 | 0.80% | 0.10%(+0.700)#26 | 4.2%(-3.40)#13,455 |
| 27. | 85131 | 0.70% | 0.10%(+0.600)#27 | 4.2%(-3.50)#13,626 |
| 28. | 85253 | 0.70% | 0.10%(+0.600)#28 | 4.2%(-3.50)#13,628 |
| 29. | 85007 | 0.70% | 0.10%(+0.600)#29 | 4.2%(-3.50)#13,655 |
| 30. | 85935 | 0.70% | 0.10%(+0.600)#30 | 4.2%(-3.50)#13,739 |
| 31. | 86512 | 0.70% | 0.10%(+0.600)#31 | 4.2%(-3.50)#13,780 |
| 32. | 86442 | 0.60% | 0.10%(+0.500)#32 | 4.2%(-3.60)#13,919 |
| 33. | 86322 | 0.60% | 0.10%(+0.500)#33 | 4.2%(-3.60)#14,041 |
| 34. | 86413 | 0.60% | 0.10%(+0.500)#34 | 4.2%(-3.60)#14,046 |
| 35. | 86351 | 0.60% | 0.10%(+0.500)#35 | 4.2%(-3.60)#14,106 |
| 36. | 85204 | 0.50% | 0.10%(+0.400)#36 | 4.2%(-3.70)#14,270 |
| 37. | 86303 | 0.50% | 0.10%(+0.400)#37 | 4.2%(-3.70)#14,423 |
| 38. | 86034 | 0.50% | 0.10%(+0.400)#38 | 4.2%(-3.70)#14,656 |
| 39. | 85629 | 0.40% | 0.10%(+0.300)#39 | 4.2%(-3.80)#14,819 |
| 40. | 85305 | 0.40% | 0.10%(+0.300)#40 | 4.2%(-3.80)#14,935 |
| 41. | 85354 | 0.40% | 0.10%(+0.300)#41 | 4.2%(-3.80)#15,024 |
| 42. | 85296 | 0.30% | 0.10%(+0.200)#42 | 4.2%(-3.90)#15,231 |
| 43. | 85303 | 0.30% | 0.10%(+0.200)#43 | 4.2%(-3.90)#15,312 |
| 44. | 86401 | 0.30% | 0.10%(+0.200)#44 | 4.2%(-3.90)#15,358 |
| 45. | 85019 | 0.30% | 0.10%(+0.200)#45 | 4.2%(-3.90)#15,378 |
| 46. | 85119 | 0.30% | 0.10%(+0.200)#46 | 4.2%(-3.90)#15,434 |
| 47. | 86406 | 0.30% | 0.10%(+0.200)#47 | 4.2%(-3.90)#15,435 |
| 48. | 85284 | 0.30% | 0.10%(+0.200)#48 | 4.2%(-3.90)#15,492 |
| 49. | 85901 | 0.30% | 0.10%(+0.200)#49 | 4.2%(-3.90)#15,493 |
| 50. | 85941 | 0.30% | 0.10%(+0.200)#50 | 4.2%(-3.90)#15,613 |
| 51. | 85390 | 0.30% | 0.10%(+0.200)#51 | 4.2%(-3.90)#15,622 |
| 52. | 85344 | 0.30% | 0.10%(+0.200)#52 | 4.2%(-3.90)#15,637 |
| 53. | 85032 | 0.20% | 0.10%(+0.100)#53 | 4.2%(-4.00)#15,854 |
| 54. | 85281 | 0.20% | 0.10%(+0.100)#54 | 4.2%(-4.00)#15,855 |
| 55. | 85706 | 0.20% | 0.10%(+0.100)#55 | 4.2%(-4.00)#15,885 |
| 56. | 85201 | 0.20% | 0.10%(+0.100)#56 | 4.2%(-4.00)#15,908 |
| 57. | 85234 | 0.20% | 0.10%(+0.100)#57 | 4.2%(-4.00)#15,915 |
| 58. | 85379 | 0.20% | 0.10%(+0.100)#58 | 4.2%(-4.00)#15,922 |
| 59. | 85086 | 0.20% | 0.10%(+0.100)#59 | 4.2%(-4.00)#15,959 |
| 60. | 85213 | 0.20% | 0.10%(+0.100)#60 | 4.2%(-4.00)#16,026 |
| 61. | 85020 | 0.20% | 0.10%(+0.100)#61 | 4.2%(-4.00)#16,054 |
| 62. | 85747 | 0.20% | 0.10%(+0.100)#62 | 4.2%(-4.00)#16,190 |
| 63. | 85014 | 0.20% | 0.10%(+0.100)#63 | 4.2%(-4.00)#16,191 |
| 64. | 85006 | 0.20% | 0.10%(+0.100)#64 | 4.2%(-4.00)#16,213 |
| 65. | 86327 | 0.20% | 0.10%(+0.100)#65 | 4.2%(-4.00)#16,444 |
| 66. | 85348 | 0.20% | 0.10%(+0.100)#66 | 4.2%(-4.00)#16,601 |
| 67. | 85142 | 0.10% | 0.10%(=0.000)#67 | 4.2%(-4.10)#16,653 |
| 68. | 85122 | 0.10% | 0.10%(=0.000)#68 | 4.2%(-4.10)#16,749 |
| 69. | 85295 | 0.10% | 0.10%(=0.000)#69 | 4.2%(-4.10)#16,758 |
| 70. | 85035 | 0.10% | 0.10%(=0.000)#70 | 4.2%(-4.10)#16,759 |
| 71. | 85282 | 0.10% | 0.10%(=0.000)#71 | 4.2%(-4.10)#16,774 |
| 72. | 85009 | 0.10% | 0.10%(=0.000)#72 | 4.2%(-4.10)#16,785 |
| 73. | 85365 | 0.10% | 0.10%(=0.000)#73 | 4.2%(-4.10)#16,796 |
| 74. | 85029 | 0.10% | 0.10%(=0.000)#74 | 4.2%(-4.10)#16,813 |
| 75. | 85138 | 0.10% | 0.10%(=0.000)#75 | 4.2%(-4.10)#16,817 |
| 76. | 85719 | 0.10% | 0.10%(=0.000)#76 | 4.2%(-4.10)#16,820 |
| 77. | 85140 | 0.10% | 0.10%(=0.000)#77 | 4.2%(-4.10)#16,822 |
| 78. | 85286 | 0.10% | 0.10%(=0.000)#78 | 4.2%(-4.10)#16,833 |
| 79. | 85713 | 0.10% | 0.10%(=0.000)#79 | 4.2%(-4.10)#16,860 |
| 80. | 85746 | 0.10% | 0.10%(=0.000)#80 | 4.2%(-4.10)#16,863 |
| 81. | 85226 | 0.10% | 0.10%(=0.000)#81 | 4.2%(-4.10)#16,936 |
| 82. | 85382 | 0.10% | 0.10%(=0.000)#82 | 4.2%(-4.10)#16,945 |
| 83. | 85209 | 0.10% | 0.10%(=0.000)#83 | 4.2%(-4.10)#16,947 |
| 84. | 85251 | 0.10% | 0.10%(=0.000)#84 | 4.2%(-4.10)#16,955 |
| 85. | 85043 | 0.10% | 0.10%(=0.000)#85 | 4.2%(-4.10)#16,966 |
| 86. | 85202 | 0.10% | 0.10%(=0.000)#86 | 4.2%(-4.10)#16,973 |
| 87. | 85027 | 0.10% | 0.10%(=0.000)#87 | 4.2%(-4.10)#16,986 |
| 88. | 85233 | 0.10% | 0.10%(=0.000)#88 | 4.2%(-4.10)#16,991 |
| 89. | 85203 | 0.10% | 0.10%(=0.000)#89 | 4.2%(-4.10)#16,997 |
| 90. | 85208 | 0.10% | 0.10%(=0.000)#90 | 4.2%(-4.10)#17,011 |
| 91. | 85745 | 0.10% | 0.10%(=0.000)#91 | 4.2%(-4.10)#17,017 |
| 92. | 85248 | 0.10% | 0.10%(=0.000)#92 | 4.2%(-4.10)#17,049 |
| 93. | 85340 | 0.10% | 0.10%(=0.000)#93 | 4.2%(-4.10)#17,053 |
| 94. | 85375 | 0.10% | 0.10%(=0.000)#94 | 4.2%(-4.10)#17,283 |
| 95. | 85258 | 0.10% | 0.10%(=0.000)#95 | 4.2%(-4.10)#17,316 |
| 96. | 85614 | 0.10% | 0.10%(=0.000)#96 | 4.2%(-4.10)#17,352 |
| 97. | 85546 | 0.10% | 0.10%(=0.000)#97 | 4.2%(-4.10)#17,439 |
| 98. | 86323 | 0.10% | 0.10%(=0.000)#98 | 4.2%(-4.10)#17,484 |
| 99. | 86305 | 0.10% | 0.10%(=0.000)#99 | 4.2%(-4.10)#17,490 |
| 100. | 85607 | 0.10% | 0.10%(=0.000)#100 | 4.2%(-4.10)#17,523 |
Common Questions
What are the Top 10 Zip Codes with the Highest Percentage of Households Heated by Fuel Oil / Kerosene in Arizona?
Top 10 Zip Codes with the Highest Percentage of Households Heated by Fuel Oil / Kerosene in Arizona are:
What zip code has the Highest Percentage of Households Heated by Fuel Oil / Kerosene in Arizona?
85542 has the Highest Percentage of Households Heated by Fuel Oil / Kerosene in Arizona with 19.2%.
What is the Percentage of Households Heated by Fuel Oil / Kerosene in the State of Arizona?
Percentage of Households Heated by Fuel Oil / Kerosene in Arizona is 0.10%.
What is the Percentage of Households Heated by Fuel Oil / Kerosene in the United States?
Percentage of Households Heated by Fuel Oil / Kerosene in the United States is 4.2%.