Zip Codes with the Highest Percentage of Households Heated by Fuel Oil / Kerosene in California
RELATED REPORTS & OPTIONS
Fuel Oil Heating
California
Compare Zip Codes
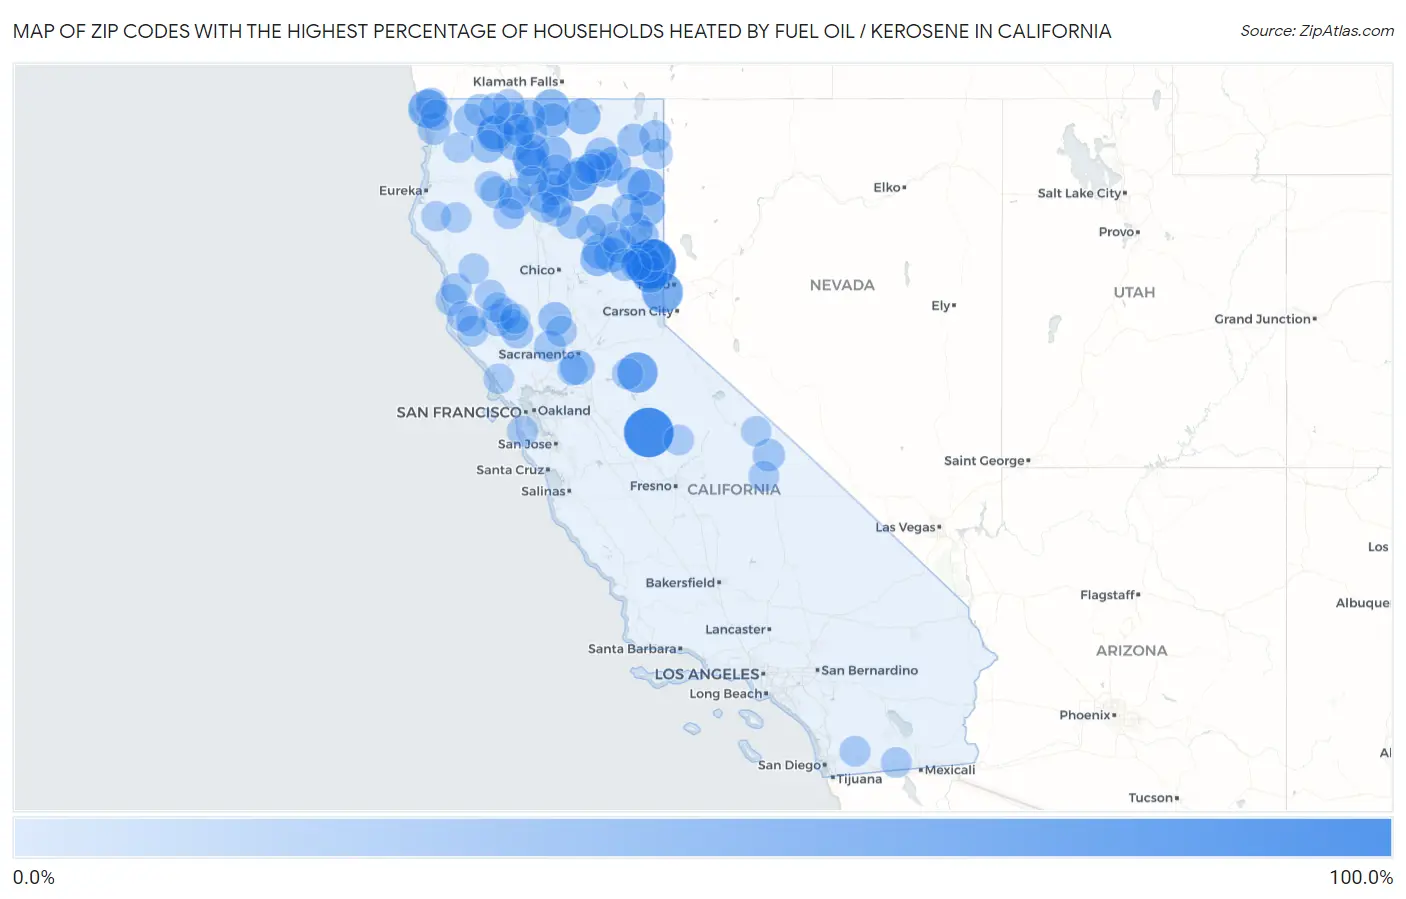
Map of Zip Codes with the Highest Percentage of Households Heated by Fuel Oil / Kerosene in California
0.0%
100.0%
Zip Codes with the Highest Percentage of Households Heated by Fuel Oil / Kerosene in California
| Zip Code | Fuel Oil Heating | vs State | vs National | |
| 1. | 96135 | 100.0% | 0.20%(+99.8)#1 | 4.2%(+95.8)#34 |
| 2. | 95325 | 100.0% | 0.20%(+99.8)#2 | 4.2%(+95.8)#56 |
| 3. | 96111 | 57.1% | 0.20%(+56.9)#3 | 4.2%(+52.9)#1,311 |
| 4. | 95248 | 54.8% | 0.20%(+54.6)#4 | 4.2%(+50.6)#1,504 |
| 5. | 96016 | 54.5% | 0.20%(+54.3)#5 | 4.2%(+50.3)#1,527 |
| 6. | 96129 | 47.1% | 0.20%(+46.9)#6 | 4.2%(+42.9)#2,042 |
| 7. | 95538 | 45.9% | 0.20%(+45.7)#7 | 4.2%(+41.7)#2,107 |
| 8. | 96123 | 38.1% | 0.20%(+37.9)#8 | 4.2%(+33.9)#2,705 |
| 9. | 96023 | 37.1% | 0.20%(+36.9)#9 | 4.2%(+32.9)#2,782 |
| 10. | 96037 | 35.0% | 0.20%(+34.8)#10 | 4.2%(+30.8)#2,958 |
| 11. | 96134 | 34.2% | 0.20%(+34.0)#11 | 4.2%(+30.0)#3,024 |
| 12. | 96118 | 33.2% | 0.20%(+33.0)#12 | 4.2%(+29.0)#3,089 |
| 13. | 96017 | 32.1% | 0.20%(+31.9)#13 | 4.2%(+27.9)#3,168 |
| 14. | 96034 | 31.5% | 0.20%(+31.3)#14 | 4.2%(+27.3)#3,220 |
| 15. | 96117 | 31.0% | 0.20%(+30.8)#15 | 4.2%(+26.8)#3,261 |
| 16. | 95984 | 30.3% | 0.20%(+30.1)#16 | 4.2%(+26.1)#3,312 |
| 17. | 96057 | 30.1% | 0.20%(+29.9)#17 | 4.2%(+25.9)#3,326 |
| 18. | 96025 | 29.2% | 0.20%(+29.0)#18 | 4.2%(+25.0)#3,397 |
| 19. | 96009 | 27.9% | 0.20%(+27.7)#19 | 4.2%(+23.7)#3,516 |
| 20. | 95639 | 27.5% | 0.20%(+27.3)#20 | 4.2%(+23.3)#3,554 |
| 21. | 95971 | 27.2% | 0.20%(+27.0)#21 | 4.2%(+23.0)#3,576 |
| 22. | 95956 | 27.2% | 0.20%(+27.0)#22 | 4.2%(+23.0)#3,579 |
| 23. | 96006 | 25.5% | 0.20%(+25.3)#23 | 4.2%(+21.3)#3,725 |
| 24. | 96032 | 25.1% | 0.20%(+24.9)#24 | 4.2%(+20.9)#3,760 |
| 25. | 96097 | 24.8% | 0.20%(+24.6)#25 | 4.2%(+20.6)#3,793 |
| 26. | 96067 | 24.7% | 0.20%(+24.5)#26 | 4.2%(+20.5)#3,803 |
| 27. | 96058 | 23.8% | 0.20%(+23.6)#27 | 4.2%(+19.6)#3,882 |
| 28. | 96068 | 23.5% | 0.20%(+23.3)#28 | 4.2%(+19.3)#3,923 |
| 29. | 96105 | 22.9% | 0.20%(+22.7)#29 | 4.2%(+18.7)#3,991 |
| 30. | 95983 | 22.4% | 0.20%(+22.2)#30 | 4.2%(+18.2)#4,030 |
| 31. | 96064 | 22.2% | 0.20%(+22.0)#31 | 4.2%(+18.0)#4,046 |
| 32. | 96132 | 22.2% | 0.20%(+22.0)#32 | 4.2%(+18.0)#4,053 |
| 33. | 95950 | 21.6% | 0.20%(+21.4)#33 | 4.2%(+17.4)#4,110 |
| 34. | 96008 | 21.0% | 0.20%(+20.8)#34 | 4.2%(+16.8)#4,180 |
| 35. | 96027 | 20.6% | 0.20%(+20.4)#35 | 4.2%(+16.4)#4,220 |
| 36. | 96028 | 20.6% | 0.20%(+20.4)#36 | 4.2%(+16.4)#4,221 |
| 37. | 96114 | 20.1% | 0.20%(+19.9)#37 | 4.2%(+15.9)#4,268 |
| 38. | 96087 | 19.1% | 0.20%(+18.9)#38 | 4.2%(+14.9)#4,389 |
| 39. | 96121 | 18.6% | 0.20%(+18.4)#39 | 4.2%(+14.4)#4,451 |
| 40. | 96063 | 18.6% | 0.20%(+18.4)#40 | 4.2%(+14.4)#4,453 |
| 41. | 96054 | 18.0% | 0.20%(+17.8)#41 | 4.2%(+13.8)#4,522 |
| 42. | 96101 | 17.9% | 0.20%(+17.7)#42 | 4.2%(+13.7)#4,529 |
| 43. | 96094 | 17.8% | 0.20%(+17.6)#43 | 4.2%(+13.6)#4,549 |
| 44. | 96065 | 17.6% | 0.20%(+17.4)#44 | 4.2%(+13.4)#4,579 |
| 45. | 93513 | 16.9% | 0.20%(+16.7)#45 | 4.2%(+12.7)#4,689 |
| 46. | 95548 | 16.8% | 0.20%(+16.6)#46 | 4.2%(+12.6)#4,708 |
| 47. | 96039 | 16.7% | 0.20%(+16.5)#47 | 4.2%(+12.5)#4,722 |
| 48. | 95453 | 16.6% | 0.20%(+16.4)#48 | 4.2%(+12.4)#4,738 |
| 49. | 96137 | 15.9% | 0.20%(+15.7)#49 | 4.2%(+11.7)#4,848 |
| 50. | 96104 | 15.8% | 0.20%(+15.6)#50 | 4.2%(+11.6)#4,870 |
| 51. | 96033 | 15.6% | 0.20%(+15.4)#51 | 4.2%(+11.4)#4,908 |
| 52. | 96103 | 15.4% | 0.20%(+15.2)#52 | 4.2%(+11.2)#4,933 |
| 53. | 96086 | 15.2% | 0.20%(+15.0)#53 | 4.2%(+11.0)#4,966 |
| 54. | 96130 | 14.9% | 0.20%(+14.7)#54 | 4.2%(+10.7)#5,002 |
| 55. | 96093 | 14.9% | 0.20%(+14.7)#55 | 4.2%(+10.7)#5,007 |
| 56. | 95567 | 14.9% | 0.20%(+14.7)#56 | 4.2%(+10.7)#5,011 |
| 57. | 96044 | 14.9% | 0.20%(+14.7)#57 | 4.2%(+10.7)#5,012 |
| 58. | 96038 | 14.2% | 0.20%(+14.0)#58 | 4.2%(+10.00)#5,148 |
| 59. | 96096 | 14.0% | 0.20%(+13.8)#59 | 4.2%(+9.80)#5,182 |
| 60. | 95457 | 13.8% | 0.20%(+13.6)#60 | 4.2%(+9.60)#5,211 |
| 61. | 96109 | 13.8% | 0.20%(+13.6)#61 | 4.2%(+9.60)#5,219 |
| 62. | 95531 | 13.2% | 0.20%(+13.0)#62 | 4.2%(+9.00)#5,298 |
| 63. | 96122 | 13.1% | 0.20%(+12.9)#63 | 4.2%(+8.90)#5,328 |
| 64. | 96084 | 12.9% | 0.20%(+12.7)#64 | 4.2%(+8.70)#5,379 |
| 65. | 95458 | 12.6% | 0.20%(+12.4)#65 | 4.2%(+8.40)#5,438 |
| 66. | 95653 | 12.6% | 0.20%(+12.4)#66 | 4.2%(+8.40)#5,448 |
| 67. | 96050 | 12.4% | 0.20%(+12.2)#67 | 4.2%(+8.20)#5,499 |
| 68. | 95460 | 12.3% | 0.20%(+12.1)#68 | 4.2%(+8.10)#5,506 |
| 69. | 95422 | 12.2% | 0.20%(+12.0)#69 | 4.2%(+8.00)#5,518 |
| 70. | 96011 | 11.7% | 0.20%(+11.5)#70 | 4.2%(+7.50)#5,660 |
| 71. | 95245 | 11.3% | 0.20%(+11.1)#71 | 4.2%(+7.10)#5,737 |
| 72. | 95437 | 10.9% | 0.20%(+10.7)#72 | 4.2%(+6.70)#5,838 |
| 73. | 95645 | 10.5% | 0.20%(+10.3)#73 | 4.2%(+6.30)#5,948 |
| 74. | 95494 | 9.9% | 0.20%(+9.70)#74 | 4.2%(+5.70)#6,106 |
| 75. | 94018 | 9.7% | 0.20%(+9.50)#75 | 4.2%(+5.50)#6,149 |
| 76. | 95947 | 9.6% | 0.20%(+9.40)#76 | 4.2%(+5.40)#6,183 |
| 77. | 91916 | 9.5% | 0.20%(+9.30)#77 | 4.2%(+5.30)#6,217 |
| 78. | 95466 | 9.5% | 0.20%(+9.30)#78 | 4.2%(+5.30)#6,219 |
| 79. | 93526 | 9.4% | 0.20%(+9.20)#79 | 4.2%(+5.20)#6,248 |
| 80. | 95415 | 9.3% | 0.20%(+9.10)#80 | 4.2%(+5.10)#6,274 |
| 81. | 96047 | 9.1% | 0.20%(+8.90)#81 | 4.2%(+4.90)#6,337 |
| 82. | 96088 | 9.0% | 0.20%(+8.80)#82 | 4.2%(+4.80)#6,350 |
| 83. | 95469 | 9.0% | 0.20%(+8.80)#83 | 4.2%(+4.80)#6,361 |
| 84. | 92259 | 9.0% | 0.20%(+8.80)#84 | 4.2%(+4.80)#6,369 |
| 85. | 93601 | 8.9% | 0.20%(+8.70)#85 | 4.2%(+4.70)#6,392 |
| 86. | 95612 | 8.8% | 0.20%(+8.60)#86 | 4.2%(+4.60)#6,430 |
| 87. | 95429 | 8.2% | 0.20%(+8.00)#87 | 4.2%(+4.00)#6,657 |
| 88. | 96056 | 8.1% | 0.20%(+7.90)#88 | 4.2%(+3.90)#6,681 |
| 89. | 96110 | 8.0% | 0.20%(+7.80)#89 | 4.2%(+3.80)#6,733 |
| 90. | 93514 | 7.9% | 0.20%(+7.70)#90 | 4.2%(+3.70)#6,740 |
| 91. | 96048 | 7.9% | 0.20%(+7.70)#91 | 4.2%(+3.70)#6,758 |
| 92. | 95556 | 7.9% | 0.20%(+7.70)#92 | 4.2%(+3.70)#6,762 |
| 93. | 94971 | 7.9% | 0.20%(+7.70)#93 | 4.2%(+3.70)#6,766 |
| 94. | 96051 | 7.7% | 0.20%(+7.50)#94 | 4.2%(+3.50)#6,839 |
| 95. | 95485 | 7.6% | 0.20%(+7.40)#95 | 4.2%(+3.40)#6,880 |
| 96. | 96062 | 7.5% | 0.20%(+7.30)#96 | 4.2%(+3.30)#6,935 |
| 97. | 95526 | 7.4% | 0.20%(+7.20)#97 | 4.2%(+3.20)#6,975 |
| 98. | 95423 | 7.2% | 0.20%(+7.00)#98 | 4.2%(+3.00)#7,035 |
| 99. | 96020 | 7.1% | 0.20%(+6.90)#99 | 4.2%(+2.90)#7,071 |
| 100. | 95565 | 7.1% | 0.20%(+6.90)#100 | 4.2%(+2.90)#7,081 |
Common Questions
What are the Top 10 Zip Codes with the Highest Percentage of Households Heated by Fuel Oil / Kerosene in California?
Top 10 Zip Codes with the Highest Percentage of Households Heated by Fuel Oil / Kerosene in California are:
What zip code has the Highest Percentage of Households Heated by Fuel Oil / Kerosene in California?
96135 has the Highest Percentage of Households Heated by Fuel Oil / Kerosene in California with 100.0%.
What is the Percentage of Households Heated by Fuel Oil / Kerosene in the State of California?
Percentage of Households Heated by Fuel Oil / Kerosene in California is 0.20%.
What is the Percentage of Households Heated by Fuel Oil / Kerosene in the United States?
Percentage of Households Heated by Fuel Oil / Kerosene in the United States is 4.2%.