Zip Codes with the Highest Percentage of Households Heated by Fuel Oil / Kerosene in Kansas
RELATED REPORTS & OPTIONS
Fuel Oil Heating
Kansas
Compare Zip Codes
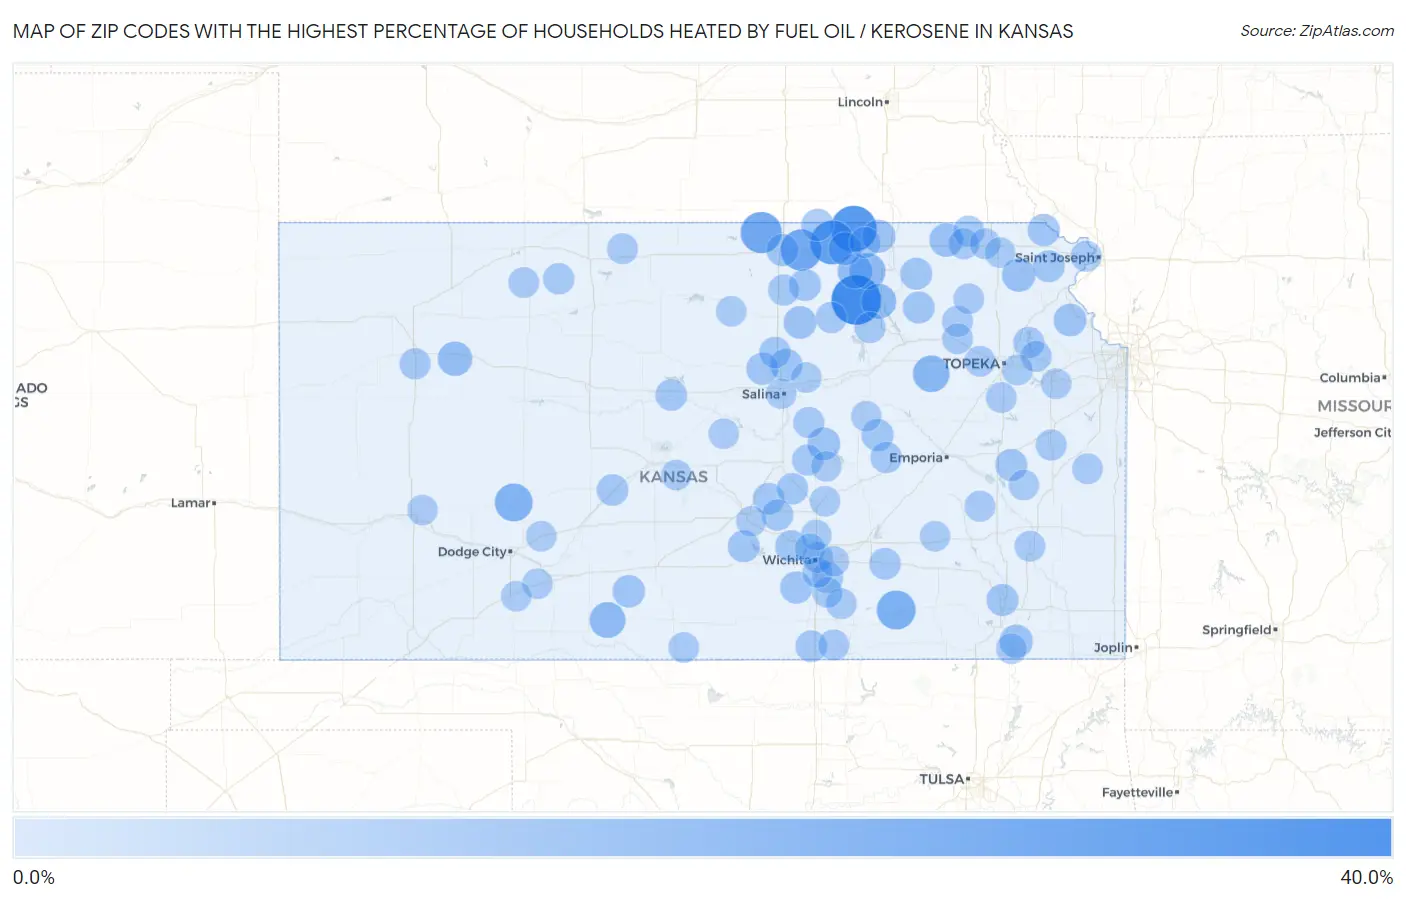
Map of Zip Codes with the Highest Percentage of Households Heated by Fuel Oil / Kerosene in Kansas
0.0%
40.0%
Zip Codes with the Highest Percentage of Households Heated by Fuel Oil / Kerosene in Kansas
| Zip Code | Fuel Oil Heating | vs State | vs National | |
| 1. | 67447 | 33.1% | 0.20%(+32.9)#1 | 4.2%(+28.9)#3,096 |
| 2. | 66946 | 26.9% | 0.20%(+26.7)#2 | 4.2%(+22.7)#3,600 |
| 3. | 66958 | 23.5% | 0.20%(+23.3)#3 | 4.2%(+19.3)#3,922 |
| 4. | 66940 | 18.7% | 0.20%(+18.5)#4 | 4.2%(+14.5)#4,431 |
| 5. | 66964 | 18.5% | 0.20%(+18.3)#5 | 4.2%(+14.3)#4,463 |
| 6. | 67023 | 14.5% | 0.20%(+14.3)#6 | 4.2%(+10.3)#5,097 |
| 7. | 67854 | 12.9% | 0.20%(+12.7)#7 | 4.2%(+8.70)#5,376 |
| 8. | 66401 | 10.8% | 0.20%(+10.6)#8 | 4.2%(+6.60)#5,870 |
| 9. | 66933 | 9.8% | 0.20%(+9.60)#9 | 4.2%(+5.60)#6,135 |
| 10. | 67155 | 9.3% | 0.20%(+9.10)#10 | 4.2%(+5.10)#6,283 |
| 11. | 66554 | 8.0% | 0.20%(+7.80)#11 | 4.2%(+3.80)#6,721 |
| 12. | 66943 | 7.7% | 0.20%(+7.50)#12 | 4.2%(+3.50)#6,847 |
| 13. | 67737 | 7.0% | 0.20%(+6.80)#13 | 4.2%(+2.80)#7,140 |
| 14. | 66404 | 5.6% | 0.20%(+5.40)#14 | 4.2%(+1.40)#7,815 |
| 15. | 66439 | 5.4% | 0.20%(+5.20)#15 | 4.2%(+1.20)#7,911 |
| 16. | 67351 | 5.0% | 0.20%(+4.80)#16 | 4.2%(+0.800)#8,150 |
| 17. | 66968 | 4.9% | 0.20%(+4.70)#17 | 4.2%(+0.700)#8,199 |
| 18. | 66412 | 4.5% | 0.20%(+4.30)#18 | 4.2%(+0.300)#8,475 |
| 19. | 67466 | 4.2% | 0.20%(+4.00)#19 | 4.2%(=0.000)#8,691 |
| 20. | 67438 | 4.2% | 0.20%(+4.00)#20 | 4.2%(=0.000)#8,698 |
| 21. | 66020 | 4.1% | 0.20%(+3.90)#21 | 4.2%(-0.100)#8,754 |
| 22. | 67422 | 3.9% | 0.20%(+3.70)#22 | 4.2%(-0.300)#8,891 |
| 23. | 67028 | 3.7% | 0.20%(+3.50)#23 | 4.2%(-0.500)#9,100 |
| 24. | 67026 | 3.5% | 0.20%(+3.30)#24 | 4.2%(-0.700)#9,225 |
| 25. | 66955 | 3.4% | 0.20%(+3.20)#25 | 4.2%(-0.800)#9,387 |
| 26. | 67484 | 3.3% | 0.20%(+3.10)#26 | 4.2%(-0.900)#9,461 |
| 27. | 66094 | 3.3% | 0.20%(+3.10)#27 | 4.2%(-0.900)#9,469 |
| 28. | 66935 | 3.2% | 0.20%(+3.00)#28 | 4.2%(-1.00)#9,527 |
| 29. | 67570 | 3.0% | 0.20%(+2.80)#29 | 4.2%(-1.20)#9,725 |
| 30. | 66871 | 3.0% | 0.20%(+2.80)#30 | 4.2%(-1.20)#9,728 |
| 31. | 66838 | 3.0% | 0.20%(+2.80)#31 | 4.2%(-1.20)#9,750 |
| 32. | 66757 | 2.9% | 0.20%(+2.70)#32 | 4.2%(-1.30)#9,810 |
| 33. | 67030 | 2.9% | 0.20%(+2.70)#33 | 4.2%(-1.30)#9,813 |
| 34. | 66549 | 2.9% | 0.20%(+2.70)#34 | 4.2%(-1.30)#9,835 |
| 35. | 66427 | 2.8% | 0.20%(+2.60)#35 | 4.2%(-1.40)#9,939 |
| 36. | 66938 | 2.7% | 0.20%(+2.50)#36 | 4.2%(-1.50)#10,046 |
| 37. | 66017 | 2.7% | 0.20%(+2.50)#37 | 4.2%(-1.50)#10,079 |
| 38. | 67522 | 2.5% | 0.20%(+2.30)#38 | 4.2%(-1.70)#10,270 |
| 39. | 67550 | 2.3% | 0.20%(+2.10)#39 | 4.2%(-1.90)#10,493 |
| 40. | 67074 | 2.3% | 0.20%(+2.10)#40 | 4.2%(-1.90)#10,546 |
| 41. | 67140 | 2.3% | 0.20%(+2.10)#41 | 4.2%(-1.90)#10,552 |
| 42. | 67634 | 2.3% | 0.20%(+2.10)#42 | 4.2%(-1.90)#10,575 |
| 43. | 67467 | 2.1% | 0.20%(+1.90)#43 | 4.2%(-2.10)#10,803 |
| 44. | 66850 | 2.1% | 0.20%(+1.90)#44 | 4.2%(-2.10)#10,865 |
| 45. | 67107 | 2.0% | 0.20%(+1.80)#45 | 4.2%(-2.20)#10,951 |
| 46. | 67020 | 2.0% | 0.20%(+1.80)#46 | 4.2%(-2.20)#10,973 |
| 47. | 66901 | 1.7% | 0.20%(+1.50)#47 | 4.2%(-2.50)#11,399 |
| 48. | 67748 | 1.7% | 0.20%(+1.50)#48 | 4.2%(-2.50)#11,433 |
| 49. | 66945 | 1.7% | 0.20%(+1.50)#49 | 4.2%(-2.50)#11,473 |
| 50. | 67646 | 1.7% | 0.20%(+1.50)#50 | 4.2%(-2.50)#11,479 |
| 51. | 67448 | 1.6% | 0.20%(+1.40)#51 | 4.2%(-2.60)#11,645 |
| 52. | 67037 | 1.5% | 0.20%(+1.30)#52 | 4.2%(-2.70)#11,698 |
| 53. | 66070 | 1.5% | 0.20%(+1.30)#53 | 4.2%(-2.70)#11,797 |
| 54. | 66531 | 1.5% | 0.20%(+1.30)#54 | 4.2%(-2.70)#11,814 |
| 55. | 67432 | 1.4% | 0.20%(+1.20)#55 | 4.2%(-2.80)#11,944 |
| 56. | 66090 | 1.4% | 0.20%(+1.20)#56 | 4.2%(-2.80)#11,976 |
| 57. | 67428 | 1.4% | 0.20%(+1.20)#57 | 4.2%(-2.80)#12,002 |
| 58. | 66408 | 1.4% | 0.20%(+1.20)#58 | 4.2%(-2.80)#12,036 |
| 59. | 66073 | 1.3% | 0.20%(+1.10)#59 | 4.2%(-2.90)#12,176 |
| 60. | 66078 | 1.3% | 0.20%(+1.10)#60 | 4.2%(-2.90)#12,230 |
| 61. | 66538 | 1.2% | 0.20%(+1.000)#61 | 4.2%(-3.00)#12,368 |
| 62. | 66542 | 1.2% | 0.20%(+1.000)#62 | 4.2%(-3.00)#12,379 |
| 63. | 66422 | 1.2% | 0.20%(+1.000)#63 | 4.2%(-3.00)#12,417 |
| 64. | 66951 | 1.2% | 0.20%(+1.000)#64 | 4.2%(-3.00)#12,434 |
| 65. | 67214 | 1.1% | 0.20%(+0.900)#65 | 4.2%(-3.10)#12,503 |
| 66. | 66852 | 1.1% | 0.20%(+0.900)#66 | 4.2%(-3.10)#12,666 |
| 67. | 67051 | 1.1% | 0.20%(+0.900)#67 | 4.2%(-3.10)#12,671 |
| 68. | 66536 | 0.90% | 0.20%(+0.700)#68 | 4.2%(-3.30)#13,100 |
| 69. | 66534 | 0.90% | 0.20%(+0.700)#69 | 4.2%(-3.30)#13,107 |
| 70. | 66615 | 0.90% | 0.20%(+0.700)#70 | 4.2%(-3.30)#13,114 |
| 71. | 66414 | 0.90% | 0.20%(+0.700)#71 | 4.2%(-3.30)#13,131 |
| 72. | 67146 | 0.90% | 0.20%(+0.700)#72 | 4.2%(-3.30)#13,151 |
| 73. | 66072 | 0.90% | 0.20%(+0.700)#73 | 4.2%(-3.30)#13,170 |
| 74. | 66748 | 0.80% | 0.20%(+0.600)#74 | 4.2%(-3.40)#13,443 |
| 75. | 67070 | 0.80% | 0.20%(+0.600)#75 | 4.2%(-3.40)#13,502 |
| 76. | 66540 | 0.80% | 0.20%(+0.600)#76 | 4.2%(-3.40)#13,509 |
| 77. | 67645 | 0.80% | 0.20%(+0.600)#77 | 4.2%(-3.40)#13,511 |
| 78. | 67147 | 0.70% | 0.20%(+0.500)#78 | 4.2%(-3.50)#13,665 |
| 79. | 67420 | 0.70% | 0.20%(+0.500)#79 | 4.2%(-3.50)#13,747 |
| 80. | 66093 | 0.70% | 0.20%(+0.500)#80 | 4.2%(-3.50)#13,855 |
| 81. | 67876 | 0.60% | 0.20%(+0.400)#81 | 4.2%(-3.60)#14,206 |
| 82. | 67842 | 0.60% | 0.20%(+0.400)#82 | 4.2%(-3.60)#14,257 |
| 83. | 67204 | 0.50% | 0.20%(+0.300)#83 | 4.2%(-3.70)#14,403 |
| 84. | 67114 | 0.50% | 0.20%(+0.300)#84 | 4.2%(-3.70)#14,413 |
| 85. | 67110 | 0.50% | 0.20%(+0.300)#85 | 4.2%(-3.70)#14,524 |
| 86. | 67045 | 0.50% | 0.20%(+0.300)#86 | 4.2%(-3.70)#14,605 |
| 87. | 67526 | 0.50% | 0.20%(+0.300)#87 | 4.2%(-3.70)#14,616 |
| 88. | 67480 | 0.50% | 0.20%(+0.300)#88 | 4.2%(-3.70)#14,648 |
| 89. | 67865 | 0.50% | 0.20%(+0.300)#89 | 4.2%(-3.70)#14,679 |
| 90. | 67846 | 0.40% | 0.20%(+0.200)#90 | 4.2%(-3.80)#14,784 |
| 91. | 67216 | 0.40% | 0.20%(+0.200)#91 | 4.2%(-3.80)#14,865 |
| 92. | 66046 | 0.40% | 0.20%(+0.200)#92 | 4.2%(-3.80)#14,900 |
| 93. | 67230 | 0.40% | 0.20%(+0.200)#93 | 4.2%(-3.80)#14,973 |
| 94. | 67337 | 0.40% | 0.20%(+0.200)#94 | 4.2%(-3.80)#14,982 |
| 95. | 67063 | 0.40% | 0.20%(+0.200)#95 | 4.2%(-3.80)#15,087 |
| 96. | 67449 | 0.40% | 0.20%(+0.200)#96 | 4.2%(-3.80)#15,104 |
| 97. | 67444 | 0.40% | 0.20%(+0.200)#97 | 4.2%(-3.80)#15,183 |
| 98. | 66425 | 0.40% | 0.20%(+0.200)#98 | 4.2%(-3.80)#15,187 |
| 99. | 67401 | 0.30% | 0.20%(+0.100)#99 | 4.2%(-3.90)#15,230 |
| 100. | 67501 | 0.30% | 0.20%(+0.100)#100 | 4.2%(-3.90)#15,427 |
Common Questions
What are the Top 10 Zip Codes with the Highest Percentage of Households Heated by Fuel Oil / Kerosene in Kansas?
Top 10 Zip Codes with the Highest Percentage of Households Heated by Fuel Oil / Kerosene in Kansas are:
What zip code has the Highest Percentage of Households Heated by Fuel Oil / Kerosene in Kansas?
67447 has the Highest Percentage of Households Heated by Fuel Oil / Kerosene in Kansas with 33.1%.
What is the Percentage of Households Heated by Fuel Oil / Kerosene in the State of Kansas?
Percentage of Households Heated by Fuel Oil / Kerosene in Kansas is 0.20%.
What is the Percentage of Households Heated by Fuel Oil / Kerosene in the United States?
Percentage of Households Heated by Fuel Oil / Kerosene in the United States is 4.2%.