Zip Codes with the Highest Percentage of Households Heated by Fuel Oil / Kerosene in Missouri
RELATED REPORTS & OPTIONS
Fuel Oil Heating
Missouri
Compare Zip Codes
Map of Zip Codes with the Highest Percentage of Households Heated by Fuel Oil / Kerosene in Missouri
0.0%
80.0%
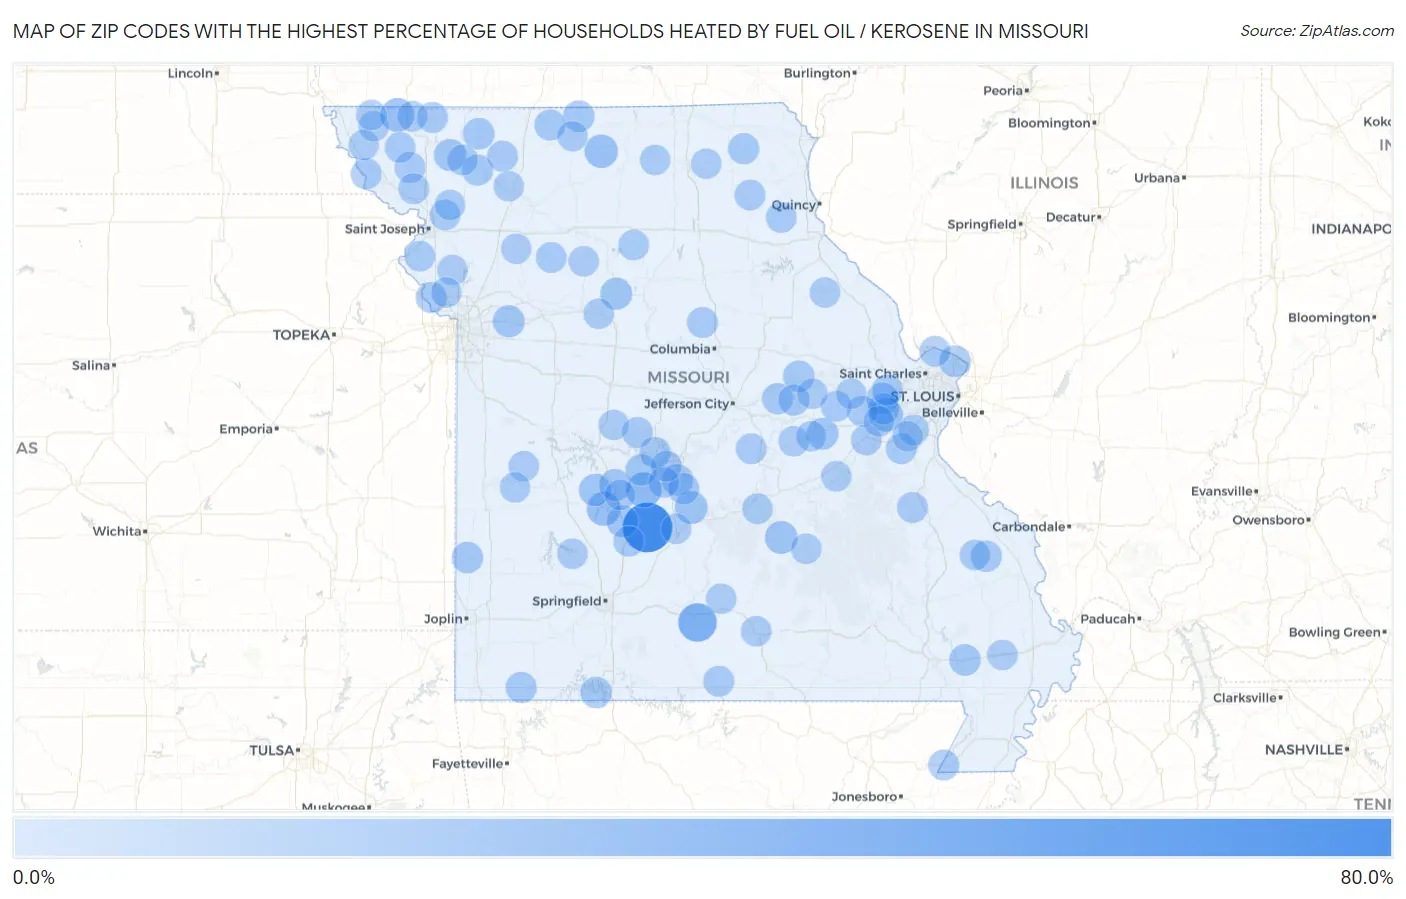
Zip Codes with the Highest Percentage of Households Heated by Fuel Oil / Kerosene in Missouri
| Zip Code | Fuel Oil Heating | vs State | vs National | |
| 1. | 65783 | 68.6% | 0.20%(+68.4)#1 | 4.2%(+64.4)#588 |
| 2. | 65702 | 29.1% | 0.20%(+28.9)#2 | 4.2%(+24.9)#3,408 |
| 3. | 65786 | 17.9% | 0.20%(+17.7)#3 | 4.2%(+13.7)#4,532 |
| 4. | 65724 | 13.1% | 0.20%(+12.9)#4 | 4.2%(+8.90)#5,332 |
| 5. | 64445 | 12.6% | 0.20%(+12.4)#5 | 4.2%(+8.40)#5,451 |
| 6. | 63039 | 11.3% | 0.20%(+11.1)#6 | 4.2%(+7.10)#5,746 |
| 7. | 64645 | 11.0% | 0.20%(+10.8)#7 | 4.2%(+6.80)#5,835 |
| 8. | 65541 | 8.9% | 0.20%(+8.70)#8 | 4.2%(+4.70)#6,402 |
| 9. | 65567 | 8.8% | 0.20%(+8.60)#9 | 4.2%(+4.60)#6,429 |
| 10. | 65779 | 6.7% | 0.20%(+6.50)#10 | 4.2%(+2.50)#7,259 |
| 11. | 64432 | 6.3% | 0.20%(+6.10)#11 | 4.2%(+2.10)#7,469 |
| 12. | 64066 | 6.3% | 0.20%(+6.10)#12 | 4.2%(+2.10)#7,473 |
| 13. | 63332 | 6.2% | 0.20%(+6.00)#13 | 4.2%(+2.00)#7,495 |
| 14. | 65634 | 6.2% | 0.20%(+6.00)#14 | 4.2%(+2.00)#7,507 |
| 15. | 63091 | 5.8% | 0.20%(+5.60)#15 | 4.2%(+1.60)#7,692 |
| 16. | 65344 | 5.8% | 0.20%(+5.60)#16 | 4.2%(+1.60)#7,704 |
| 17. | 65685 | 5.6% | 0.20%(+5.40)#17 | 4.2%(+1.40)#7,806 |
| 18. | 63386 | 5.1% | 0.20%(+4.90)#18 | 4.2%(+0.900)#8,107 |
| 19. | 64499 | 5.1% | 0.20%(+4.90)#19 | 4.2%(+0.900)#8,111 |
| 20. | 65324 | 4.8% | 0.20%(+4.60)#20 | 4.2%(+0.600)#8,264 |
| 21. | 64661 | 4.6% | 0.20%(+4.40)#21 | 4.2%(+0.400)#8,416 |
| 22. | 63936 | 4.6% | 0.20%(+4.40)#22 | 4.2%(+0.400)#8,422 |
| 23. | 64762 | 4.4% | 0.20%(+4.20)#23 | 4.2%(+0.200)#8,527 |
| 24. | 65052 | 4.1% | 0.20%(+3.90)#24 | 4.2%(-0.100)#8,739 |
| 25. | 65611 | 4.1% | 0.20%(+3.90)#25 | 4.2%(-0.100)#8,751 |
| 26. | 65069 | 4.0% | 0.20%(+3.80)#26 | 4.2%(-0.200)#8,847 |
| 27. | 65037 | 3.7% | 0.20%(+3.50)#27 | 4.2%(-0.500)#9,064 |
| 28. | 63781 | 3.6% | 0.20%(+3.40)#28 | 4.2%(-0.600)#9,162 |
| 29. | 63055 | 3.5% | 0.20%(+3.30)#29 | 4.2%(-0.700)#9,254 |
| 30. | 65591 | 3.4% | 0.20%(+3.20)#30 | 4.2%(-0.800)#9,350 |
| 31. | 65024 | 3.3% | 0.20%(+3.10)#31 | 4.2%(-0.900)#9,459 |
| 32. | 63563 | 3.3% | 0.20%(+3.10)#32 | 4.2%(-0.900)#9,464 |
| 33. | 65061 | 3.3% | 0.20%(+3.10)#33 | 4.2%(-0.900)#9,465 |
| 34. | 64438 | 3.3% | 0.20%(+3.10)#34 | 4.2%(-0.900)#9,475 |
| 35. | 65772 | 3.1% | 0.20%(+2.90)#35 | 4.2%(-1.10)#9,615 |
| 36. | 64632 | 2.9% | 0.20%(+2.70)#36 | 4.2%(-1.30)#9,863 |
| 37. | 63341 | 2.8% | 0.20%(+2.60)#37 | 4.2%(-1.40)#9,916 |
| 38. | 65256 | 2.7% | 0.20%(+2.50)#38 | 4.2%(-1.50)#10,036 |
| 39. | 64028 | 2.7% | 0.20%(+2.50)#39 | 4.2%(-1.50)#10,083 |
| 40. | 63653 | 2.6% | 0.20%(+2.40)#40 | 4.2%(-1.60)#10,173 |
| 41. | 64437 | 2.6% | 0.20%(+2.40)#41 | 4.2%(-1.60)#10,193 |
| 42. | 64455 | 2.6% | 0.20%(+2.40)#42 | 4.2%(-1.60)#10,198 |
| 43. | 64461 | 2.5% | 0.20%(+2.30)#43 | 4.2%(-1.70)#10,284 |
| 44. | 64471 | 2.5% | 0.20%(+2.30)#44 | 4.2%(-1.70)#10,297 |
| 45. | 63829 | 2.4% | 0.20%(+2.20)#45 | 4.2%(-1.80)#10,406 |
| 46. | 64449 | 2.4% | 0.20%(+2.20)#46 | 4.2%(-1.80)#10,419 |
| 47. | 63023 | 2.3% | 0.20%(+2.10)#47 | 4.2%(-1.90)#10,494 |
| 48. | 63090 | 2.2% | 0.20%(+2.00)#48 | 4.2%(-2.00)#10,598 |
| 49. | 65020 | 2.2% | 0.20%(+2.00)#49 | 4.2%(-2.00)#10,608 |
| 50. | 65760 | 2.2% | 0.20%(+2.00)#50 | 4.2%(-2.00)#10,716 |
| 51. | 65079 | 2.1% | 0.20%(+1.90)#51 | 4.2%(-2.10)#10,780 |
| 52. | 63458 | 2.1% | 0.20%(+1.90)#52 | 4.2%(-2.10)#10,868 |
| 53. | 63068 | 2.0% | 0.20%(+1.80)#53 | 4.2%(-2.20)#10,924 |
| 54. | 64489 | 2.0% | 0.20%(+1.80)#54 | 4.2%(-2.20)#10,962 |
| 55. | 65622 | 1.9% | 0.20%(+1.70)#55 | 4.2%(-2.30)#11,069 |
| 56. | 65078 | 1.9% | 0.20%(+1.70)#56 | 4.2%(-2.30)#11,098 |
| 57. | 64436 | 1.9% | 0.20%(+1.70)#57 | 4.2%(-2.30)#11,157 |
| 58. | 63373 | 1.9% | 0.20%(+1.70)#58 | 4.2%(-2.30)#11,167 |
| 59. | 64487 | 1.9% | 0.20%(+1.70)#59 | 4.2%(-2.30)#11,170 |
| 60. | 65001 | 1.9% | 0.20%(+1.70)#60 | 4.2%(-2.30)#11,195 |
| 61. | 64624 | 1.8% | 0.20%(+1.60)#61 | 4.2%(-2.40)#11,304 |
| 62. | 63077 | 1.7% | 0.20%(+1.50)#62 | 4.2%(-2.50)#11,382 |
| 63. | 65550 | 1.6% | 0.20%(+1.40)#63 | 4.2%(-2.60)#11,587 |
| 64. | 63463 | 1.6% | 0.20%(+1.40)#64 | 4.2%(-2.60)#11,654 |
| 65. | 64431 | 1.6% | 0.20%(+1.40)#65 | 4.2%(-2.60)#11,672 |
| 66. | 64676 | 1.6% | 0.20%(+1.40)#66 | 4.2%(-2.60)#11,682 |
| 67. | 65732 | 1.5% | 0.20%(+1.30)#67 | 4.2%(-2.70)#11,816 |
| 68. | 65535 | 1.4% | 0.20%(+1.20)#68 | 4.2%(-2.80)#11,995 |
| 69. | 63662 | 1.4% | 0.20%(+1.20)#69 | 4.2%(-2.80)#12,022 |
| 70. | 65793 | 1.3% | 0.20%(+1.10)#70 | 4.2%(-2.90)#12,137 |
| 71. | 64440 | 1.3% | 0.20%(+1.10)#71 | 4.2%(-2.90)#12,225 |
| 72. | 64682 | 1.3% | 0.20%(+1.10)#72 | 4.2%(-2.90)#12,244 |
| 73. | 64444 | 1.2% | 0.20%(+1.000)#73 | 4.2%(-3.00)#12,411 |
| 74. | 63544 | 1.2% | 0.20%(+1.000)#74 | 4.2%(-3.00)#12,423 |
| 75. | 64446 | 1.2% | 0.20%(+1.000)#75 | 4.2%(-3.00)#12,424 |
| 76. | 64163 | 1.2% | 0.20%(+1.000)#76 | 4.2%(-3.00)#12,428 |
| 77. | 65339 | 1.2% | 0.20%(+1.000)#77 | 4.2%(-3.00)#12,443 |
| 78. | 63051 | 1.1% | 0.20%(+0.900)#78 | 4.2%(-3.10)#12,517 |
| 79. | 63016 | 1.1% | 0.20%(+0.900)#79 | 4.2%(-3.10)#12,557 |
| 80. | 65014 | 1.1% | 0.20%(+0.900)#80 | 4.2%(-3.10)#12,602 |
| 81. | 64724 | 1.1% | 0.20%(+0.900)#81 | 4.2%(-3.10)#12,617 |
| 82. | 63846 | 1.1% | 0.20%(+0.900)#82 | 4.2%(-3.10)#12,647 |
| 83. | 63533 | 1.1% | 0.20%(+0.900)#83 | 4.2%(-3.10)#12,653 |
| 84. | 64783 | 1.1% | 0.20%(+0.900)#84 | 4.2%(-3.10)#12,661 |
| 85. | 64459 | 1.1% | 0.20%(+0.900)#85 | 4.2%(-3.10)#12,673 |
| 86. | 65711 | 1.0% | 0.20%(+0.800)#86 | 4.2%(-3.20)#12,783 |
| 87. | 63089 | 1.0% | 0.20%(+0.800)#87 | 4.2%(-3.20)#12,794 |
| 88. | 65041 | 1.0% | 0.20%(+0.800)#88 | 4.2%(-3.20)#12,801 |
| 89. | 65325 | 1.0% | 0.20%(+0.800)#89 | 4.2%(-3.20)#12,834 |
| 90. | 63339 | 1.0% | 0.20%(+0.800)#90 | 4.2%(-3.20)#12,897 |
| 91. | 64650 | 1.0% | 0.20%(+0.800)#91 | 4.2%(-3.20)#12,908 |
| 92. | 65601 | 1.0% | 0.20%(+0.800)#92 | 4.2%(-3.20)#12,910 |
| 93. | 65560 | 0.90% | 0.20%(+0.700)#93 | 4.2%(-3.30)#13,023 |
| 94. | 63357 | 0.90% | 0.20%(+0.700)#94 | 4.2%(-3.30)#13,063 |
| 95. | 65066 | 0.90% | 0.20%(+0.700)#95 | 4.2%(-3.30)#13,076 |
| 96. | 64673 | 0.90% | 0.20%(+0.700)#96 | 4.2%(-3.30)#13,135 |
| 97. | 64491 | 0.90% | 0.20%(+0.700)#97 | 4.2%(-3.30)#13,160 |
| 98. | 64670 | 0.90% | 0.20%(+0.700)#98 | 4.2%(-3.30)#13,185 |
| 99. | 64498 | 0.90% | 0.20%(+0.700)#99 | 4.2%(-3.30)#13,210 |
| 100. | 65536 | 0.80% | 0.20%(+0.600)#100 | 4.2%(-3.40)#13,247 |
Common Questions
What are the Top 10 Zip Codes with the Highest Percentage of Households Heated by Fuel Oil / Kerosene in Missouri?
Top 10 Zip Codes with the Highest Percentage of Households Heated by Fuel Oil / Kerosene in Missouri are:
What zip code has the Highest Percentage of Households Heated by Fuel Oil / Kerosene in Missouri?
65783 has the Highest Percentage of Households Heated by Fuel Oil / Kerosene in Missouri with 68.6%.
What is the Percentage of Households Heated by Fuel Oil / Kerosene in the State of Missouri?
Percentage of Households Heated by Fuel Oil / Kerosene in Missouri is 0.20%.
What is the Percentage of Households Heated by Fuel Oil / Kerosene in the United States?
Percentage of Households Heated by Fuel Oil / Kerosene in the United States is 4.2%.