Zip Codes with the Lowest Poverty Level Among Children Under the Age of 5 in Miami, FL

RELATED REPORTS & OPTIONS

Lowest Poverty | Child 0-5
Population
Families and Households
Female Fertility
Female Fertility (Unmarried)
Race (Community Size)
Race (Percentage)
Ancestry (Community Size)
AfghanAfricanAlbanianAmericanApacheArabArgentineanArmenianAustralianAustrianBahamianBarbadianBasqueBelgianBelizeanBermudanBhutaneseBlackfeetBolivianBrazilianBritishBritish West IndianBulgarianBurmeseCanadianCelticCentral AmericanCentral American IndianCherokeeChickasawChileanChippewaChoctawColombianComancheCosta RicanCreekCroatianCubanCypriotCzechCzechoslovakianDanishDominicanDutchDutch West IndianEastern EuropeanEcuadorianEgyptianEnglishEstonianEthiopianEuropeanFilipinoFinnishFrenchFrench American IndianFrench CanadianGermanGreekGuamanian / ChamorroGuatemalanGuyaneseHaitianHonduranHungarianIcelanderIndian (Asian)IndonesianInupiatIranianIraqiIrishIroquoisIsraeliItalianJamaicanJapaneseJordanianKenyanKoreanLaotianLatvianLebaneseLithuanianMacedonianMalaysianMalteseMexicanMexican American IndianMongolianMoroccanNative HawaiianNavajoNew ZealanderNicaraguanNigerianNorthern EuropeanNorwegianPakistaniPalestinianPanamanianParaguayanPennsylvania GermanPeruvianPolishPortuguesePuerto RicanRomanianRussianSalvadoranSamoanScandinavianScotch-IrishScottishSeminoleSenegaleseSerbianSiouxSlavicSlovakSloveneSouth AfricanSouth AmericanSouth American IndianSpaniardSpanishSpanish AmericanSpanish American IndianSri LankanSubsaharan AfricanSudaneseSwedishSwissSyrianThaiTrinidadian and TobagonianTurkishU.S. Virgin IslanderUkrainianUruguayanVenezuelanVietnameseWelshWest IndianYugoslavianZimbabwean
Ancestry (Percentage)
AfghanAfricanAlbanianAmericanApacheArabArgentineanArmenianAustralianAustrianBahamianBarbadianBasqueBelgianBelizeanBermudanBhutaneseBlackfeetBolivianBrazilianBritishBritish West IndianBulgarianBurmeseCanadianCelticCentral AmericanCentral American IndianCherokeeChickasawChileanChippewaChoctawColombianComancheCosta RicanCreekCroatianCubanCypriotCzechCzechoslovakianDanishDominicanDutchDutch West IndianEastern EuropeanEcuadorianEgyptianEnglishEstonianEthiopianEuropeanFilipinoFinnishFrenchFrench American IndianFrench CanadianGermanGreekGuamanian / ChamorroGuatemalanGuyaneseHaitianHonduranHungarianIcelanderIndian (Asian)IndonesianInupiatIranianIraqiIrishIroquoisIsraeliItalianJamaicanJapaneseJordanianKenyanKoreanLaotianLatvianLebaneseLithuanianMacedonianMalaysianMalteseMexicanMexican American IndianMongolianMoroccanNative HawaiianNavajoNew ZealanderNicaraguanNigerianNorthern EuropeanNorwegianPakistaniPalestinianPanamanianParaguayanPennsylvania GermanPeruvianPolishPortuguesePuerto RicanRomanianRussianSalvadoranSamoanScandinavianScotch-IrishScottishSeminoleSenegaleseSerbianSiouxSlavicSlovakSloveneSouth AfricanSouth AmericanSouth American IndianSpaniardSpanishSpanish AmericanSpanish American IndianSri LankanSubsaharan AfricanSudaneseSwedishSwissSyrianThaiTrinidadian and TobagonianTurkishU.S. Virgin IslanderUkrainianUruguayanVenezuelanVietnameseWelshWest IndianYugoslavianZimbabwean
Immigrant Origin (Total)
AfghanistanAfricaAlbaniaArgentinaArmeniaAsiaAustraliaAustriaBahamasBangladeshBarbadosBelarusBelgiumBelizeBoliviaBosnia and HerzegovinaBrazilBulgariaBurma / MyanmarCambodiaCameroonCanadaCaribbeanCentral AmericaChileChinaColombiaCosta RicaCroatiaCubaCzechoslovakiaDenmarkDominicaDominican RepublicEastern AfricaEastern AsiaEastern EuropeEcuadorEgyptEl SalvadorEnglandEthiopiaEuropeFranceGermanyGreeceGrenadaGuatemalaGuyanaHaitiHondurasHong KongHungaryIndiaIndonesiaIranIraqIrelandIsraelItalyJamaicaJapanJordanKazakhstanKenyaKoreaKuwaitLaosLatin AmericaLatviaLebanonLithuaniaMalaysiaMexicoMiddle AfricaMoldovaMoroccoNepalNetherlandsNicaraguaNigeriaNorthern AfricaNorthern EuropeNorwayOceaniaPakistanPanamaPeruPhilippinesPolandPortugalRomaniaRussiaSaudi ArabiaScotlandSerbiaSingaporeSouth AfricaSouth AmericaSouth Central AsiaSouth Eastern AsiaSouthern EuropeSpainSri LankaSt. Vincent and the GrenadinesSudanSwedenSwitzerlandSyriaTaiwanThailandTrinidad and TobagoTurkeyUgandaUkraineUruguayUzbekistanVenezuelaVietnamWest IndiesWestern AfricaWestern AsiaWestern EuropeZaireZimbabwe
Immigrant Origin (Percentage)
AfghanistanAfricaAlbaniaArgentinaArmeniaAsiaAustraliaAustriaBahamasBangladeshBarbadosBelarusBelgiumBelizeBoliviaBosnia and HerzegovinaBrazilBulgariaBurma / MyanmarCambodiaCameroonCanadaCaribbeanCentral AmericaChileChinaColombiaCosta RicaCroatiaCubaCzechoslovakiaDenmarkDominicaDominican RepublicEastern AfricaEastern AsiaEastern EuropeEcuadorEgyptEl SalvadorEnglandEthiopiaEuropeFranceGermanyGreeceGrenadaGuatemalaGuyanaHaitiHondurasHong KongHungaryIndiaIndonesiaIranIraqIrelandIsraelItalyJamaicaJapanJordanKazakhstanKenyaKoreaKuwaitLaosLatin AmericaLatviaLebanonLithuaniaMalaysiaMexicoMiddle AfricaMoldovaMoroccoNepalNetherlandsNicaraguaNigeriaNorthern AfricaNorthern EuropeNorwayOceaniaPakistanPanamaPeruPhilippinesPolandPortugalRomaniaRussiaSaudi ArabiaScotlandSerbiaSingaporeSouth AfricaSouth AmericaSouth Central AsiaSouth Eastern AsiaSouthern EuropeSpainSri LankaSt. Vincent and the GrenadinesSudanSwedenSwitzerlandSyriaTaiwanThailandTrinidad and TobagoTurkeyUgandaUkraineUruguayUzbekistanVenezuelaVietnamWest IndiesWestern AfricaWestern AsiaWestern EuropeZaireZimbabwe
Income
Income (Families)
Income (Households)
Poverty
Poverty (Families)
Unemployment
Employment Occupations
Employment Industries
Employer Class
Commute Time
Commute Means
School Enrollment
Education by Degree Field
Occupancy
Finances
Physical Characteristics
Miami
States
Florida Cities
Altamonte SpringsApopkaArcadiaBoca RatonBoynton BeachBradentonBrandonBrooksvilleCape CoralCasselberryClearwaterClermontCocoaCoral SpringsCrestviewCrystal RiverDade CityDavenportDaytona BeachDeerfield BeachDefuniak SpringsDelandDelray BeachDeltonaDunnellonEdgewaterEnglewoodEustisFort LauderdaleFort MyersFort PierceFort Walton BeachGainesvilleGulf BreezeHialeahHolidayHollywoodHomesteadHomosassaHudsonInvernessJacksonvilleJupiterKissimmeeLake CityLake WalesLake WorthLakelandLand O LakesLargoLeesburgLehigh AcresLive OakLongwoodLutzMariannaMelbourneMerritt IslandMiamiMiami BeachMiltonNaplesNew Port RicheyNew Smyrna BeachNorth Fort MyersNorth PortOcalaOkeechobeeOpa LockaOrange ParkOrlandoOrmond BeachOviedoPalm BayPalm Beach GardensPalm CoastPalm HarborPanama CityPanama City BeachPensacolaPerryPinellas ParkPlant CityPompano BeachPort CharlottePort OrangePort Saint LuciePunta GordaQuincyRiverviewSaint AugustineSaint CloudSaint PetersburgSanfordSarasotaSebringSeminoleSpring HillStuartTallahasseeTampaTitusvilleValricoVeniceVero BeachWesley ChapelWest Palm BeachWewahitchkaWinter HavenWinter ParkZephyrhills
Compare Zip Codes
Comparison Subject

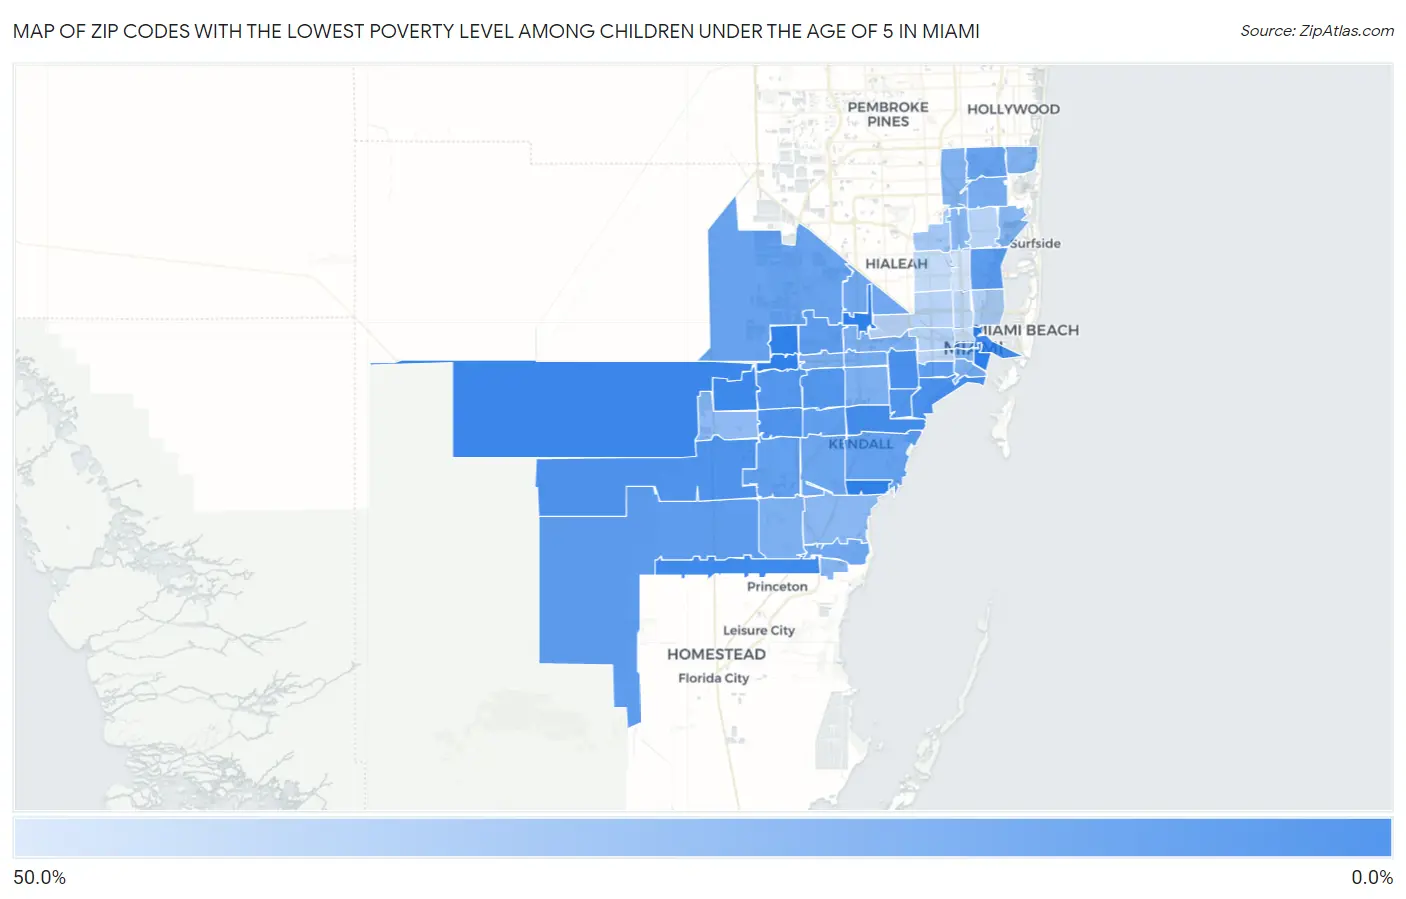
Map of Zip Codes with the Lowest Poverty Level Among Children Under the Age of 5 in Miami

50.0%
0.0%
Zip Codes with the Lowest Poverty Level Among Children Under the Age of 5 in Miami Map

Zip Codes with the Lowest Poverty Level Among Children Under the Age of 5 in Miami, FL

Zip Code Child Poverty vs State vs National
1.331941.1%19.3%(-18.1)#1018.1%(-16.9)#356
2.331851.6%19.3%(-17.7)#1618.1%(-16.5)#571
3.331702.3%19.3%(-17.0)#3118.1%(-15.8)#1,028
4.331323.0%19.3%(-16.2)#4118.1%(-15.0)#1,511
5.331433.7%19.3%(-15.6)#5418.1%(-14.4)#1,920
6.331344.8%19.3%(-14.4)#7618.1%(-13.2)#2,781
7.331335.5%19.3%(-13.7)#8818.1%(-12.5)#3,260
8.331835.9%19.3%(-13.4)#9518.1%(-12.2)#3,535
9.331966.0%19.3%(-13.2)#9718.1%(-12.0)#3,626
10.331467.0%19.3%(-12.2)#12918.1%(-11.0)#4,314
11.331657.1%19.3%(-12.2)#13018.1%(-11.0)#4,323
12.331758.1%19.3%(-11.1)#15818.1%(-9.95)#4,988
13.3317210.5%19.3%(-8.78)#22018.1%(-7.59)#6,541
14.3313810.6%19.3%(-8.66)#22418.1%(-7.47)#6,610
15.3318710.8%19.3%(-8.50)#22818.1%(-7.31)#6,698
16.3317310.9%19.3%(-8.33)#23318.1%(-7.14)#6,792
17.3314511.3%19.3%(-7.95)#24318.1%(-6.76)#7,030
18.3318611.7%19.3%(-7.59)#25218.1%(-6.40)#7,242
19.3315612.3%19.3%(-6.94)#26718.1%(-5.75)#7,639
20.3317813.0%19.3%(-6.27)#28118.1%(-5.08)#8,033
21.3317913.3%19.3%(-5.93)#29118.1%(-4.74)#8,220
22.3317614.4%19.3%(-4.89)#32418.1%(-3.70)#8,876
23.3316615.6%19.3%(-3.65)#34518.1%(-2.45)#9,548
24.3318915.8%19.3%(-3.49)#34918.1%(-2.30)#9,627
25.3314417.5%19.3%(-1.79)#38918.1%(-0.601)#10,462
26.3317417.9%19.3%(-1.34)#40218.1%(-0.152)#10,674
27.3316218.1%19.3%(-1.15)#40818.1%(+0.040)#10,756
28.3315519.1%19.3%(-0.161)#43318.1%(+1.03)#11,211
29.3312619.4%19.3%(+0.150)#44518.1%(+1.34)#11,366
30.3317719.4%19.3%(+0.188)#44718.1%(+1.38)#11,377
31.3312920.2%19.3%(+0.898)#46218.1%(+2.09)#11,715
32.3318020.8%19.3%(+1.56)#47418.1%(+2.76)#11,995
33.3316921.0%19.3%(+1.74)#47618.1%(+2.94)#12,074
34.3319022.0%19.3%(+2.79)#49218.1%(+3.99)#12,496
35.3313022.5%19.3%(+3.26)#50518.1%(+4.45)#12,715
36.3318123.1%19.3%(+3.85)#51618.1%(+5.04)#12,946
37.3316823.1%19.3%(+3.88)#51818.1%(+5.08)#12,957
38.3312823.4%19.3%(+4.10)#52018.1%(+5.29)#13,045
39.3315723.8%19.3%(+4.56)#53118.1%(+5.75)#13,246
40.3319325.3%19.3%(+6.05)#55618.1%(+7.25)#13,797
41.3316732.1%19.3%(+12.9)#63018.1%(+14.1)#15,859
42.3313737.2%19.3%(+18.0)#67618.1%(+19.2)#17,122
43.3312537.5%19.3%(+18.2)#67818.1%(+19.4)#17,185
44.3316138.6%19.3%(+19.3)#68818.1%(+20.5)#17,378
45.3314239.6%19.3%(+20.3)#69918.1%(+21.5)#17,561
46.3313541.2%19.3%(+21.9)#71218.1%(+23.1)#17,863
47.3312742.1%19.3%(+22.9)#72018.1%(+24.1)#18,040
48.3314743.9%19.3%(+24.6)#73218.1%(+25.8)#18,316
49.3313644.7%19.3%(+25.5)#73618.1%(+26.7)#18,455
50.3315048.7%19.3%(+29.4)#75618.1%(+30.6)#18,941

Common Questions

What are the Top 10 Zip Codes with the Lowest Poverty Level Among Children Under the Age of 5 in Miami, FL?
Top 10 Zip Codes with the Lowest Poverty Level Among Children Under the Age of 5 in Miami, FL are:
#1
0.0%
#2
0.0%
#3
0.0%
#4
0.0%
#5
0.0%
#6
1.1%
#7
1.6%
#8
2.3%
#9
3.0%
#10
3.7%
What zip code has the Lowest Poverty Level Among Children Under the Age of 5 in Miami, FL?
33194 has the Lowest Poverty Level Among Children Under the Age of 5 in Miami, FL with 1.1%.
What is the Poverty Level Among Children Under the Age of 5 in Miami, FL?
Poverty Level Among Children Under the Age of 5 in Miami is 26.7%.
What is the Poverty Level Among Children Under the Age of 5 in Florida?
Poverty Level Among Children Under the Age of 5 in Florida is 19.3%.
What is the Poverty Level Among Children Under the Age of 5 in the United States?
Poverty Level Among Children Under the Age of 5 in the United States is 18.1%.