Zip Codes with the Lowest Poverty Level Among Children Under the Age of 5 in Orlando, FL

RELATED REPORTS & OPTIONS

Lowest Poverty | Child 0-5
Population
Families and Households
Female Fertility
Female Fertility (Unmarried)
Race (Community Size)
Race (Percentage)
Ancestry (Community Size)
AfricanAlbanianAmericanApacheArabArgentineanArmenianAustralianAustrianBahamianBangladeshiBarbadianBasqueBelgianBelizeanBermudanBhutaneseBlackfeetBolivianBrazilianBritishBritish West IndianBulgarianBurmeseCajunCanadianCape VerdeanCelticCentral AmericanCentral American IndianCherokeeChickasawChileanChippewaChoctawColombianComancheCosta RicanCreekCroatianCubanCypriotCzechCzechoslovakianDanishDelawareDominicanDutchEastern EuropeanEcuadorianEgyptianEnglishEthiopianEuropeanFijianFilipinoFinnishFrenchFrench American IndianFrench CanadianGermanGhanaianGreekGuamanian / ChamorroGuatemalanGuyaneseHaitianHonduranHungarianIcelanderIndian (Asian)IndonesianIranianIraqiIrishIroquoisIsraeliItalianJamaicanJapaneseJordanianKenyanKoreanLaotianLatvianLebaneseLiberianLithuanianLuxembourgerMacedonianMalaysianMalteseMexicanMexican American IndianMongolianMoroccanNative HawaiianNavajoNew ZealanderNicaraguanNigerianNorthern EuropeanNorwegianOkinawanOsagePakistaniPalestinianPanamanianParaguayanPennsylvania GermanPeruvianPolishPortuguesePotawatomiPuebloPuerto RicanRomanianRussianSalvadoranSamoanScandinavianScotch-IrishScottishSeminoleSerbianSiouxSlavicSlovakSloveneSouth AfricanSouth AmericanSouth American IndianSpaniardSpanishSpanish AmericanSri LankanSubsaharan AfricanSwedishSwissSyrianThaiTrinidadian and TobagonianTurkishU.S. Virgin IslanderUkrainianUruguayanVenezuelanVietnameseWelshWest IndianYugoslavianZimbabwean
Ancestry (Percentage)
AfricanAlbanianAmericanApacheArabArgentineanArmenianAustralianAustrianBahamianBangladeshiBarbadianBasqueBelgianBelizeanBermudanBhutaneseBlackfeetBolivianBrazilianBritishBritish West IndianBulgarianBurmeseCajunCanadianCape VerdeanCelticCentral AmericanCentral American IndianCherokeeChickasawChileanChippewaChoctawColombianComancheCosta RicanCreekCroatianCubanCypriotCzechCzechoslovakianDanishDelawareDominicanDutchEastern EuropeanEcuadorianEgyptianEnglishEthiopianEuropeanFijianFilipinoFinnishFrenchFrench American IndianFrench CanadianGermanGhanaianGreekGuamanian / ChamorroGuatemalanGuyaneseHaitianHonduranHungarianIcelanderIndian (Asian)IndonesianIranianIraqiIrishIroquoisIsraeliItalianJamaicanJapaneseJordanianKenyanKoreanLaotianLatvianLebaneseLiberianLithuanianLuxembourgerMacedonianMalaysianMalteseMexicanMexican American IndianMongolianMoroccanNative HawaiianNavajoNew ZealanderNicaraguanNigerianNorthern EuropeanNorwegianOkinawanOsagePakistaniPalestinianPanamanianParaguayanPennsylvania GermanPeruvianPolishPortuguesePotawatomiPuebloPuerto RicanRomanianRussianSalvadoranSamoanScandinavianScotch-IrishScottishSeminoleSerbianSiouxSlavicSlovakSloveneSouth AfricanSouth AmericanSouth American IndianSpaniardSpanishSpanish AmericanSri LankanSubsaharan AfricanSwedishSwissSyrianThaiTrinidadian and TobagonianTurkishU.S. Virgin IslanderUkrainianUruguayanVenezuelanVietnameseWelshWest IndianYugoslavianZimbabwean
Immigrant Origin (Total)
AfricaAlbaniaArgentinaAsiaAustraliaAustriaAzoresBahamasBangladeshBarbadosBelarusBelgiumBelizeBoliviaBosnia and HerzegovinaBrazilBulgariaBurma / MyanmarCambodiaCameroonCanadaCaribbeanCentral AmericaChileChinaColombiaCosta RicaCroatiaCubaCzechoslovakiaDominicaDominican RepublicEastern AfricaEastern AsiaEastern EuropeEcuadorEgyptEl SalvadorEnglandEritreaEthiopiaEuropeFranceGermanyGhanaGreeceGrenadaGuatemalaGuyanaHaitiHondurasHong KongHungaryIndiaIndonesiaIranIraqIrelandIsraelItalyJamaicaJapanJordanKazakhstanKenyaKoreaKuwaitLaosLatin AmericaLatviaLebanonLiberiaLithuaniaMalaysiaMexicoMiddle AfricaMoldovaMoroccoNepalNetherlandsNicaraguaNigeriaNorthern AfricaNorthern EuropeNorwayOceaniaPakistanPanamaPeruPhilippinesPolandPortugalRomaniaRussiaSaudi ArabiaScotlandSerbiaSingaporeSouth AfricaSouth AmericaSouth Central AsiaSouth Eastern AsiaSouthern EuropeSpainSri LankaSt. Vincent and the GrenadinesSudanSwedenSwitzerlandSyriaTaiwanThailandTrinidad and TobagoTurkeyUkraineUruguayUzbekistanVenezuelaVietnamWest IndiesWestern AfricaWestern AsiaWestern EuropeZimbabwe
Immigrant Origin (Percentage)
AfricaAlbaniaArgentinaAsiaAustraliaAustriaAzoresBahamasBangladeshBarbadosBelarusBelgiumBelizeBoliviaBosnia and HerzegovinaBrazilBulgariaBurma / MyanmarCambodiaCameroonCanadaCaribbeanCentral AmericaChileChinaColombiaCosta RicaCroatiaCubaCzechoslovakiaDominicaDominican RepublicEastern AfricaEastern AsiaEastern EuropeEcuadorEgyptEl SalvadorEnglandEritreaEthiopiaEuropeFranceGermanyGhanaGreeceGrenadaGuatemalaGuyanaHaitiHondurasHong KongHungaryIndiaIndonesiaIranIraqIrelandIsraelItalyJamaicaJapanJordanKazakhstanKenyaKoreaKuwaitLaosLatin AmericaLatviaLebanonLiberiaLithuaniaMalaysiaMexicoMiddle AfricaMoldovaMoroccoNepalNetherlandsNicaraguaNigeriaNorthern AfricaNorthern EuropeNorwayOceaniaPakistanPanamaPeruPhilippinesPolandPortugalRomaniaRussiaSaudi ArabiaScotlandSerbiaSingaporeSouth AfricaSouth AmericaSouth Central AsiaSouth Eastern AsiaSouthern EuropeSpainSri LankaSt. Vincent and the GrenadinesSudanSwedenSwitzerlandSyriaTaiwanThailandTrinidad and TobagoTurkeyUkraineUruguayUzbekistanVenezuelaVietnamWest IndiesWestern AfricaWestern AsiaWestern EuropeZimbabwe
Income
Income (Families)
Income (Households)
Poverty
Poverty (Families)
Unemployment
Employment Occupations
Employment Industries
Employer Class
Commute Time
Commute Means
School Enrollment
Education by Degree Field
Occupancy
Finances
Physical Characteristics
Orlando
States
Florida Cities
Altamonte SpringsApopkaArcadiaBoca RatonBoynton BeachBradentonBrandonBrooksvilleCape CoralCasselberryClearwaterClermontCocoaCoral SpringsCrestviewCrystal RiverDade CityDavenportDaytona BeachDeerfield BeachDefuniak SpringsDelandDelray BeachDeltonaDunnellonEdgewaterEnglewoodEustisFort LauderdaleFort MyersFort PierceFort Walton BeachGainesvilleGulf BreezeHialeahHolidayHollywoodHomesteadHomosassaHudsonInvernessJacksonvilleJupiterKissimmeeLake CityLake WalesLake WorthLakelandLand O LakesLargoLeesburgLehigh AcresLive OakLongwoodLutzMariannaMelbourneMerritt IslandMiamiMiami BeachMiltonNaplesNew Port RicheyNew Smyrna BeachNorth Fort MyersNorth PortOcalaOkeechobeeOpa LockaOrange ParkOrlandoOrmond BeachOviedoPalm BayPalm Beach GardensPalm CoastPalm HarborPanama CityPanama City BeachPensacolaPerryPinellas ParkPlant CityPompano BeachPort CharlottePort OrangePort Saint LuciePunta GordaQuincyRiverviewSaint AugustineSaint CloudSaint PetersburgSanfordSarasotaSebringSeminoleSpring HillStuartTallahasseeTampaTitusvilleValricoVeniceVero BeachWesley ChapelWest Palm BeachWewahitchkaWinter HavenWinter ParkZephyrhills
Compare Zip Codes
Comparison Subject

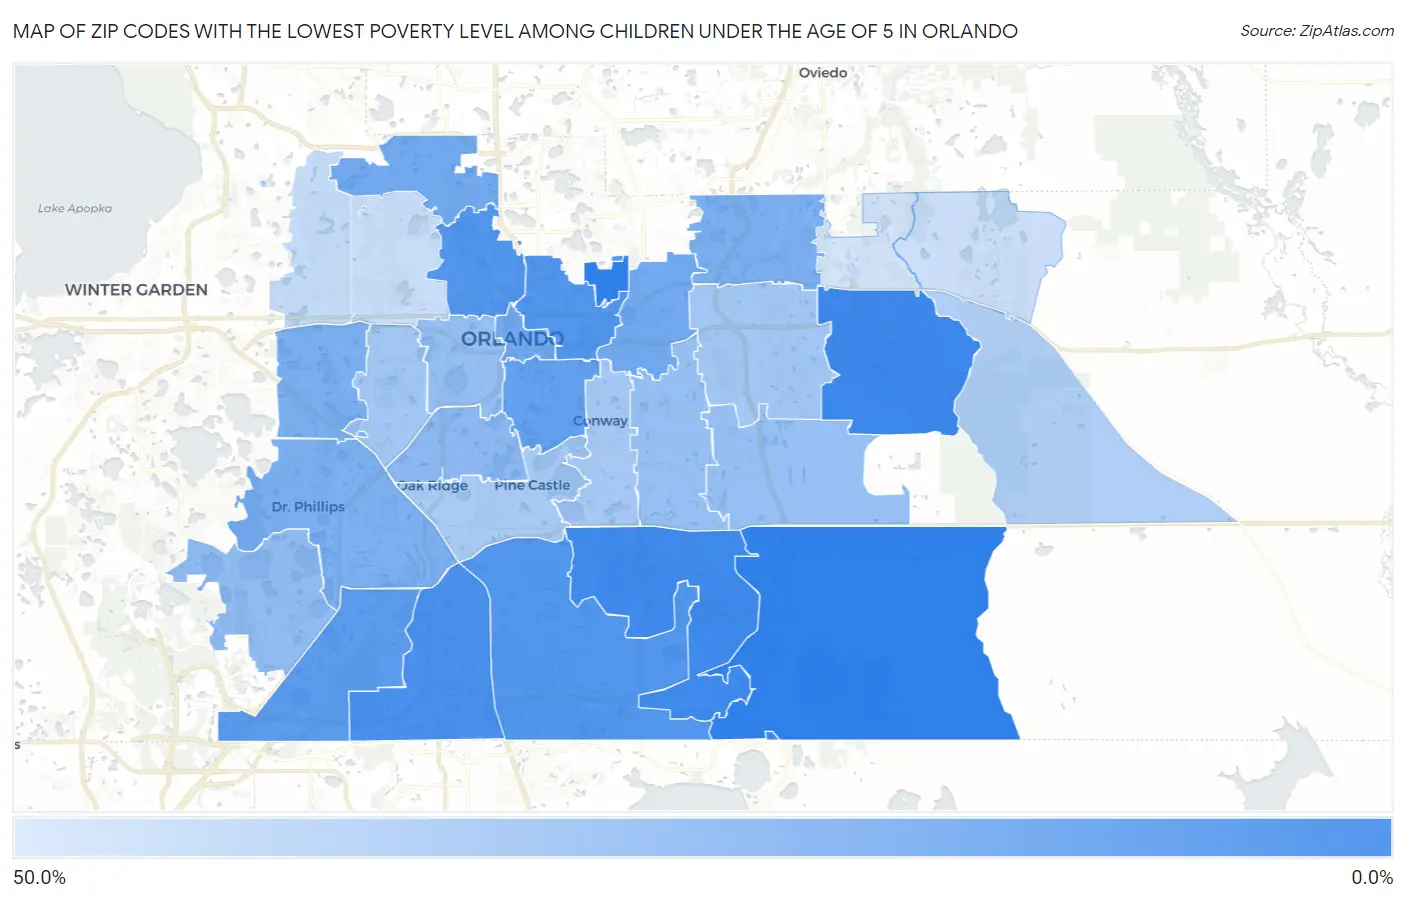
Map of Zip Codes with the Lowest Poverty Level Among Children Under the Age of 5 in Orlando

50.0%
0.0%
Zip Codes with the Lowest Poverty Level Among Children Under the Age of 5 in Orlando Map

Zip Codes with the Lowest Poverty Level Among Children Under the Age of 5 in Orlando, FL

Zip Code Child Poverty vs State vs National
1.328283.5%19.3%(-15.8)#5018.1%(-14.6)#1,811
2.328274.6%19.3%(-14.7)#6918.1%(-13.5)#2,612
3.328376.8%19.3%(-12.5)#11818.1%(-11.3)#4,119
4.328038.6%19.3%(-10.7)#16918.1%(-9.49)#5,310
5.328248.6%19.3%(-10.6)#17018.1%(-9.44)#5,354
6.328048.8%19.3%(-10.5)#17218.1%(-9.29)#5,452
7.3282111.2%19.3%(-8.09)#23918.1%(-6.90)#6,959
8.3280612.4%19.3%(-6.86)#26818.1%(-5.67)#7,703
9.3280116.3%19.3%(-2.95)#36518.1%(-1.76)#9,919
10.3281016.6%19.3%(-2.68)#37318.1%(-1.48)#10,069
11.3280716.8%19.3%(-2.44)#38018.1%(-1.25)#10,178
12.3283518.8%19.3%(-0.409)#42618.1%(+0.783)#11,101
13.3281718.9%19.3%(-0.359)#42818.1%(+0.833)#11,124
14.3281918.9%19.3%(-0.356)#42918.1%(+0.836)#11,125
15.3283922.9%19.3%(+3.64)#51418.1%(+4.83)#12,872
16.3283624.2%19.3%(+4.97)#54218.1%(+6.16)#13,401
17.3280525.3%19.3%(+6.08)#55718.1%(+7.27)#13,802
18.3282925.8%19.3%(+6.59)#56418.1%(+7.78)#13,979
19.3282226.3%19.3%(+7.05)#57118.1%(+8.24)#14,124
20.3281129.1%19.3%(+9.80)#60118.1%(+11.0)#15,046
21.3282529.5%19.3%(+10.3)#60518.1%(+11.5)#15,178
22.3281229.7%19.3%(+10.5)#60718.1%(+11.7)#15,226
23.3280930.6%19.3%(+11.3)#61618.1%(+12.5)#15,469
24.3283333.1%19.3%(+13.9)#63618.1%(+15.1)#16,111
25.3281838.9%19.3%(+19.6)#69118.1%(+20.8)#17,433
26.3280839.9%19.3%(+20.6)#70318.1%(+21.8)#17,618
27.3282040.6%19.3%(+21.3)#70518.1%(+22.5)#17,755
28.3282642.8%19.3%(+23.5)#72718.1%(+24.7)#18,144

Common Questions

What are the Top 10 Zip Codes with the Lowest Poverty Level Among Children Under the Age of 5 in Orlando, FL?
Top 10 Zip Codes with the Lowest Poverty Level Among Children Under the Age of 5 in Orlando, FL are:
#1
0.0%
#2
0.0%
#3
3.5%
#4
4.6%
#5
6.8%
#6
8.6%
#7
8.6%
#8
8.8%
#9
11.2%
#10
12.4%
What zip code has the Lowest Poverty Level Among Children Under the Age of 5 in Orlando, FL?
32828 has the Lowest Poverty Level Among Children Under the Age of 5 in Orlando, FL with 3.5%.
What is the Poverty Level Among Children Under the Age of 5 in Orlando, FL?
Poverty Level Among Children Under the Age of 5 in Orlando is 22.7%.
What is the Poverty Level Among Children Under the Age of 5 in Florida?
Poverty Level Among Children Under the Age of 5 in Florida is 19.3%.
What is the Poverty Level Among Children Under the Age of 5 in the United States?
Poverty Level Among Children Under the Age of 5 in the United States is 18.1%.