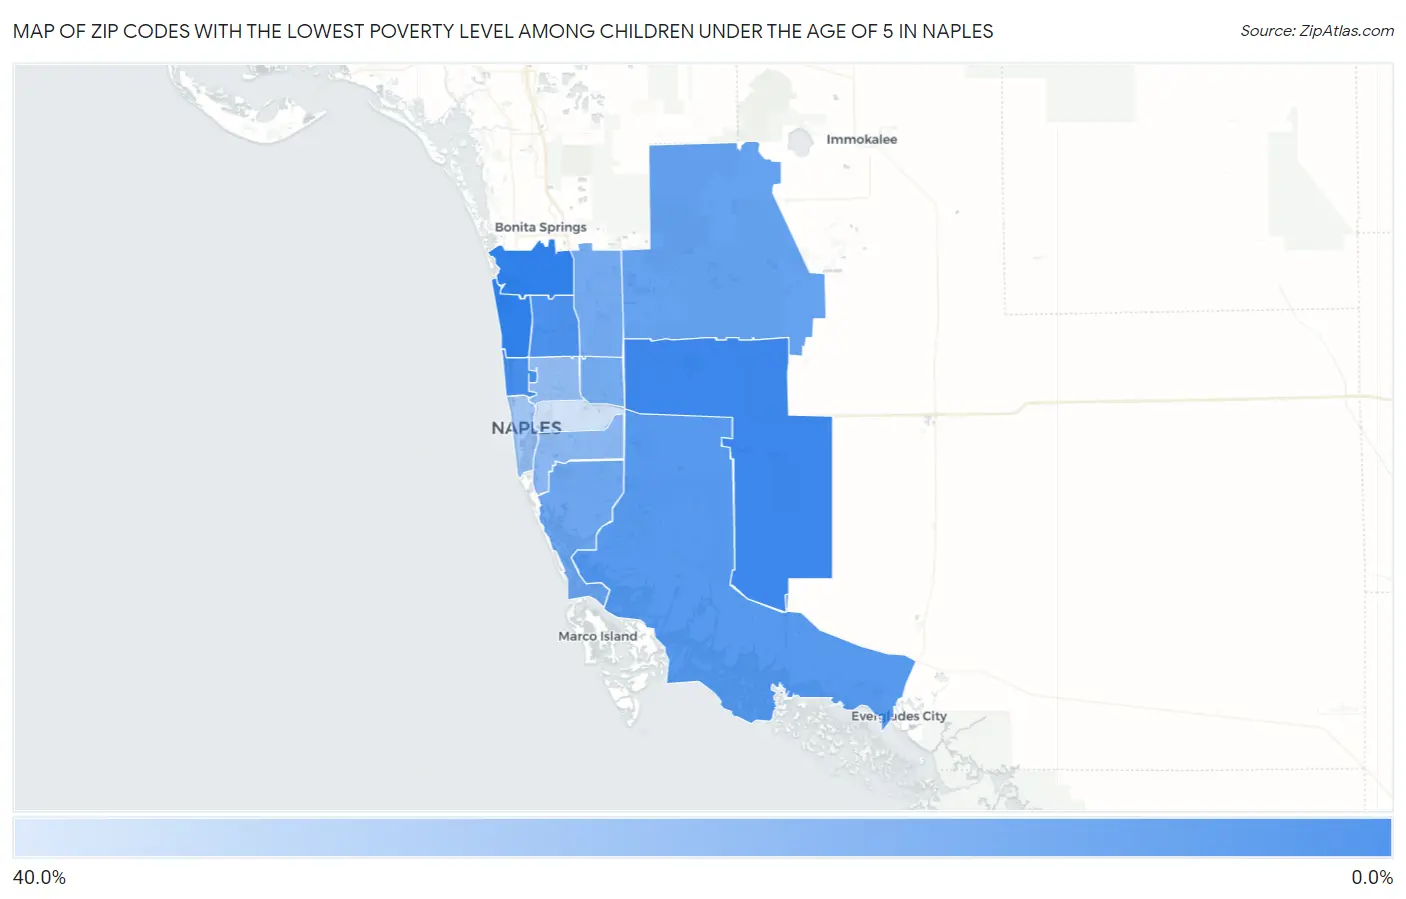
Zip Codes with the Lowest Poverty Level Among Children Under the Age of 5 in Naples, FL
RELATED REPORTS & OPTIONS
Lowest Poverty | Child 0-5
Naples
Compare Zip Codes
Map of Zip Codes with the Lowest Poverty Level Among Children Under the Age of 5 in Naples
36.7%
1.7%
Zip Codes with the Lowest Poverty Level Among Children Under the Age of 5 in Naples, FL
| Zip Code | Child Poverty | vs State | vs National | |
| 1. | 34117 | 1.7% | 19.3%(-17.6)#19 | 18.1%(-16.4)#640 |
| 2. | 34103 | 4.3% | 19.3%(-15.0)#63 | 18.1%(-13.8)#2,373 |
| 3. | 34109 | 4.8% | 19.3%(-14.4)#75 | 18.1%(-13.2)#2,777 |
| 4. | 34114 | 7.6% | 19.3%(-11.7)#145 | 18.1%(-10.5)#4,670 |
| 5. | 34120 | 10.3% | 19.3%(-8.95)#213 | 18.1%(-7.75)#6,450 |
| 6. | 34113 | 12.6% | 19.3%(-6.66)#274 | 18.1%(-5.47)#7,816 |
| 7. | 34119 | 13.2% | 19.3%(-6.05)#285 | 18.1%(-4.86)#8,155 |
| 8. | 34116 | 13.9% | 19.3%(-5.31)#306 | 18.1%(-4.12)#8,610 |
| 9. | 34112 | 18.9% | 19.3%(-0.368)#427 | 18.1%(+0.824)#11,119 |
| 10. | 34105 | 20.5% | 19.3%(+1.25)#471 | 18.1%(+2.44)#11,869 |
| 11. | 34102 | 24.4% | 19.3%(+5.19)#547 | 18.1%(+6.38)#13,476 |
| 12. | 34104 | 36.7% | 19.3%(+17.5)#674 | 18.1%(+18.7)#17,023 |
1
Common Questions
What are the Top 10 Zip Codes with the Lowest Poverty Level Among Children Under the Age of 5 in Naples, FL?
Top 10 Zip Codes with the Lowest Poverty Level Among Children Under the Age of 5 in Naples, FL are:
What zip code has the Lowest Poverty Level Among Children Under the Age of 5 in Naples, FL?
34117 has the Lowest Poverty Level Among Children Under the Age of 5 in Naples, FL with 1.7%.
What is the Poverty Level Among Children Under the Age of 5 in Naples, FL?
Poverty Level Among Children Under the Age of 5 in Naples is 18.1%.
What is the Poverty Level Among Children Under the Age of 5 in Florida?
Poverty Level Among Children Under the Age of 5 in Florida is 19.3%.
What is the Poverty Level Among Children Under the Age of 5 in the United States?
Poverty Level Among Children Under the Age of 5 in the United States is 18.1%.