West Indian vs Immigrants from Turkey Married-couple Households
COMPARE
West Indian
Immigrants from Turkey
Married-couple Households
Married-couple Households Comparison
West Indians
Immigrants from Turkey
40.3%
MARRIED-COUPLE HOUSEHOLDS
0.0/ 100
METRIC RATING
320th/ 347
METRIC RANK
46.8%
MARRIED-COUPLE HOUSEHOLDS
70.2/ 100
METRIC RATING
163rd/ 347
METRIC RANK
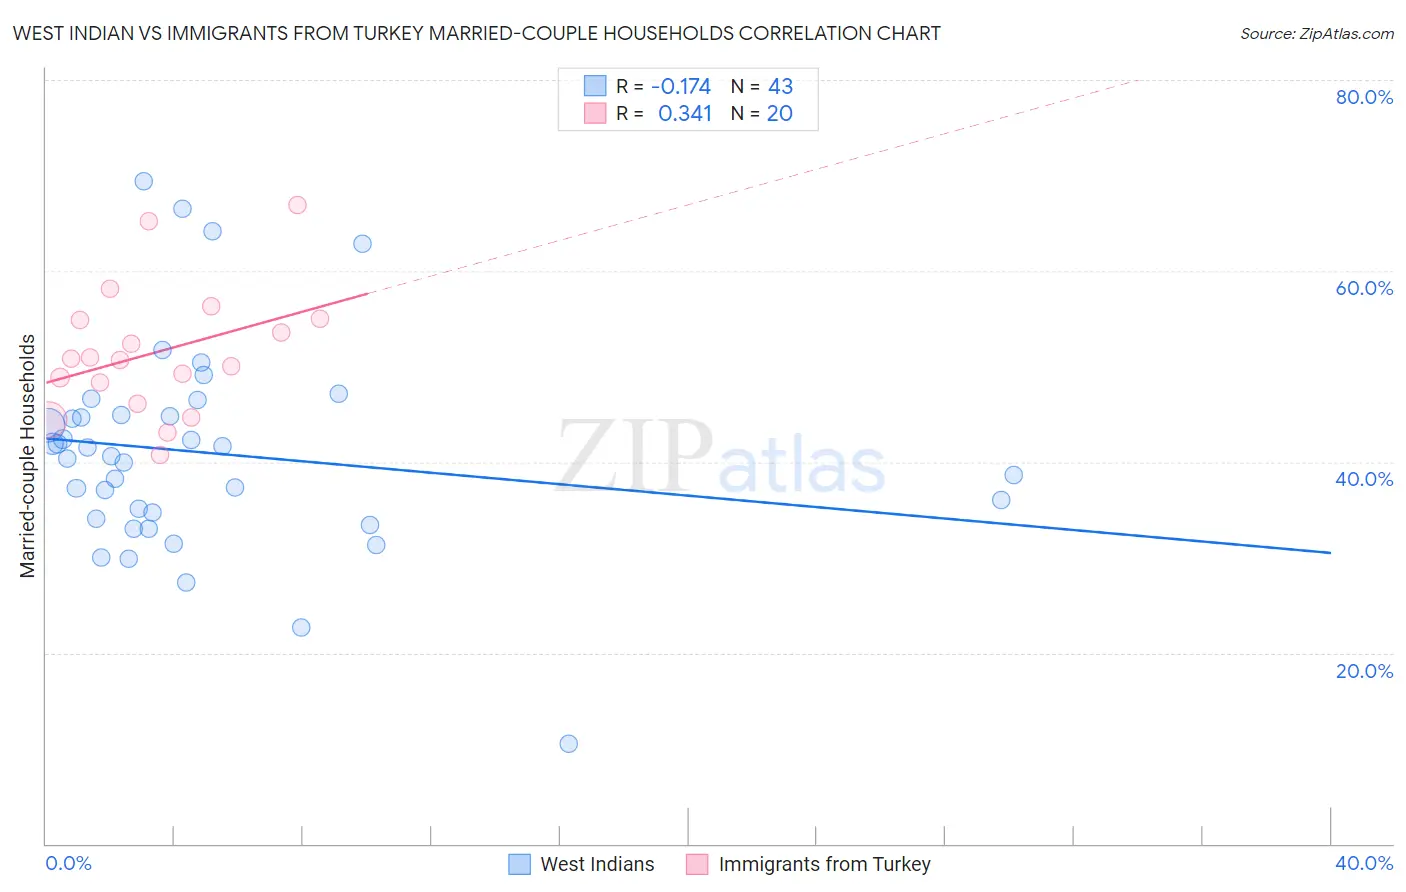
West Indian vs Immigrants from Turkey Married-couple Households Correlation Chart
The statistical analysis conducted on geographies consisting of 253,854,054 people shows a poor negative correlation between the proportion of West Indians and percentage of married-couple family households in the United States with a correlation coefficient (R) of -0.174 and weighted average of 40.3%. Similarly, the statistical analysis conducted on geographies consisting of 222,970,695 people shows a mild positive correlation between the proportion of Immigrants from Turkey and percentage of married-couple family households in the United States with a correlation coefficient (R) of 0.341 and weighted average of 46.8%, a difference of 16.1%.
Married-couple Households Correlation Summary
| Measurement | West Indian | Immigrants from Turkey |
| Minimum | 10.5% | 40.7% |
| Maximum | 69.4% | 67.0% |
| Range | 58.9% | 26.2% |
| Mean | 40.9% | 51.5% |
| Median | 40.5% | 50.8% |
| Interquartile 25% (IQ1) | 34.0% | 47.2% |
| Interquartile 75% (IQ3) | 44.9% | 54.9% |
| Interquartile Range (IQR) | 10.8% | 7.7% |
| Standard Deviation (Sample) | 11.1% | 6.7% |
| Standard Deviation (Population) | 11.0% | 6.6% |
Similar Demographics by Married-couple Households
Demographics Similar to West Indians by Married-couple Households
In terms of married-couple households, the demographic groups most similar to West Indians are Immigrants from Liberia (40.3%, a difference of 0.040%), Bahamian (40.5%, a difference of 0.42%), Immigrants from Zaire (40.1%, a difference of 0.70%), Puerto Rican (40.1%, a difference of 0.70%), and Navajo (40.1%, a difference of 0.71%).
| Demographics | Rating | Rank | Married-couple Households |
| Immigrants | Haiti | 0.0 /100 | #313 | Tragic 40.9% |
| Jamaicans | 0.0 /100 | #314 | Tragic 40.9% |
| Trinidadians and Tobagonians | 0.0 /100 | #315 | Tragic 40.9% |
| Immigrants | Caribbean | 0.0 /100 | #316 | Tragic 40.8% |
| Immigrants | Jamaica | 0.0 /100 | #317 | Tragic 40.7% |
| Liberians | 0.0 /100 | #318 | Tragic 40.7% |
| Bahamians | 0.0 /100 | #319 | Tragic 40.5% |
| West Indians | 0.0 /100 | #320 | Tragic 40.3% |
| Immigrants | Liberia | 0.0 /100 | #321 | Tragic 40.3% |
| Immigrants | Zaire | 0.0 /100 | #322 | Tragic 40.1% |
| Puerto Ricans | 0.0 /100 | #323 | Tragic 40.1% |
| Navajo | 0.0 /100 | #324 | Tragic 40.1% |
| Pueblo | 0.0 /100 | #325 | Tragic 40.0% |
| U.S. Virgin Islanders | 0.0 /100 | #326 | Tragic 39.8% |
| Lumbee | 0.0 /100 | #327 | Tragic 39.6% |
Demographics Similar to Immigrants from Turkey by Married-couple Households
In terms of married-couple households, the demographic groups most similar to Immigrants from Turkey are Immigrants from Kazakhstan (46.8%, a difference of 0.010%), Immigrants from Southern Europe (46.8%, a difference of 0.010%), Delaware (46.8%, a difference of 0.040%), Colombian (46.8%, a difference of 0.040%), and Iraqi (46.9%, a difference of 0.070%).
| Demographics | Rating | Rank | Married-couple Households |
| Armenians | 75.4 /100 | #156 | Good 46.9% |
| Immigrants | Oceania | 74.8 /100 | #157 | Good 46.9% |
| Immigrants | Nonimmigrants | 73.3 /100 | #158 | Good 46.9% |
| Osage | 73.2 /100 | #159 | Good 46.9% |
| Iraqis | 71.7 /100 | #160 | Good 46.9% |
| Delaware | 71.2 /100 | #161 | Good 46.8% |
| Colombians | 71.0 /100 | #162 | Good 46.8% |
| Immigrants | Turkey | 70.2 /100 | #163 | Good 46.8% |
| Immigrants | Kazakhstan | 70.0 /100 | #164 | Good 46.8% |
| Immigrants | Southern Europe | 69.9 /100 | #165 | Good 46.8% |
| Cherokee | 65.7 /100 | #166 | Good 46.7% |
| Immigrants | Croatia | 64.2 /100 | #167 | Good 46.7% |
| Israelis | 62.3 /100 | #168 | Good 46.7% |
| Spanish American Indians | 59.4 /100 | #169 | Average 46.6% |
| South Americans | 58.0 /100 | #170 | Average 46.6% |