Subsaharan African Male Poverty
COMPARE
Subsaharan African
Select to Compare
Male Poverty
Subsaharan African Male Poverty
13.3%
POVERTY | MALES
0.1/ 100
METRIC RATING
268th/ 347
METRIC RANK
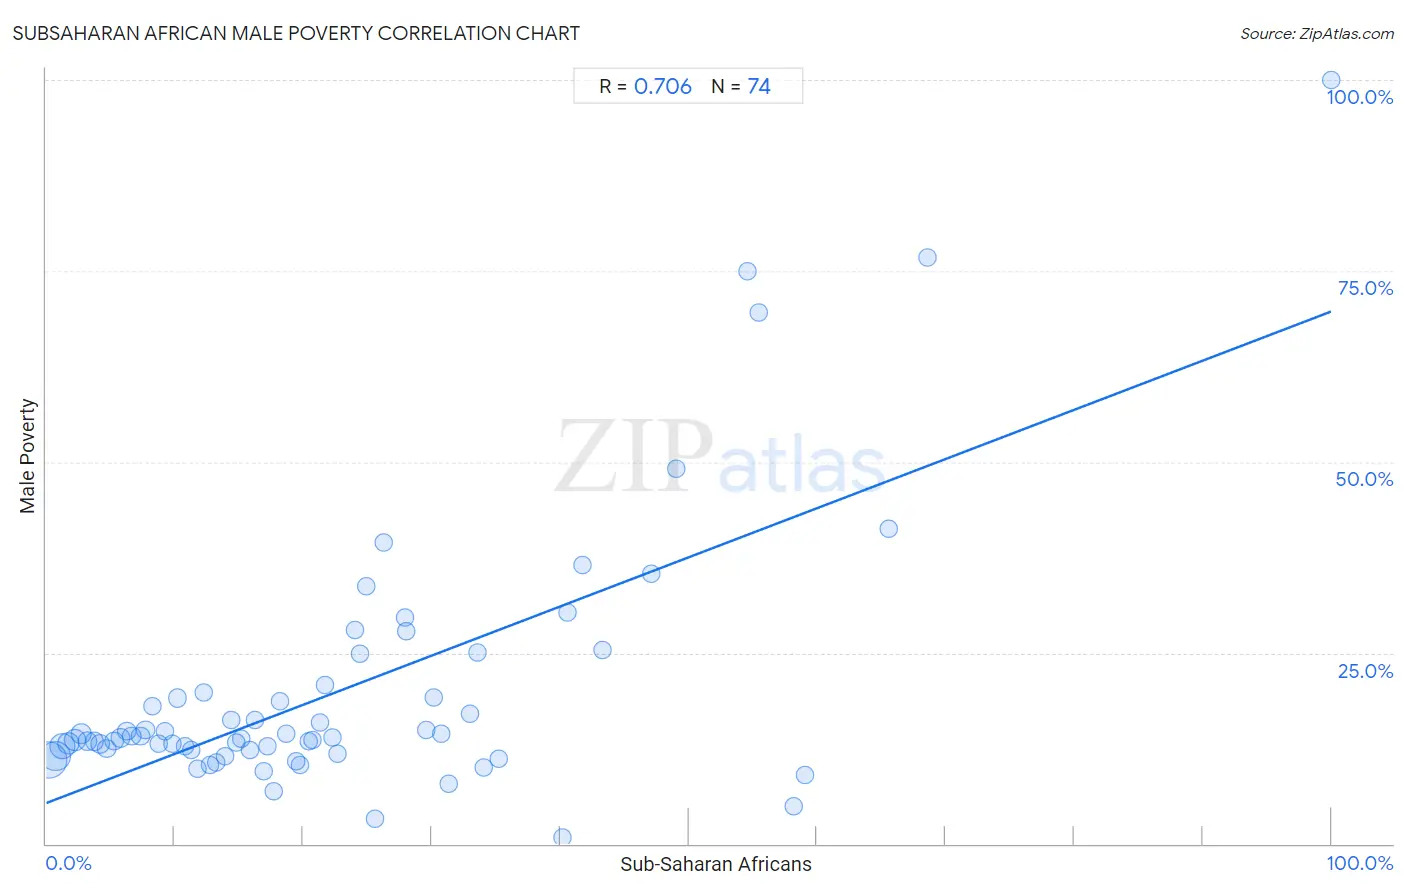
Subsaharan African Male Poverty Correlation Chart
The statistical analysis conducted on geographies consisting of 507,378,936 people shows a strong positive correlation between the proportion of Sub-Saharan Africans and poverty level among males in the United States with a correlation coefficient (R) of 0.706 and weighted average of 13.3%. On average, for every 1% (one percent) increase in Sub-Saharan Africans within a typical geography, there is an increase of 0.64% in poverty level among males.
It is essential to understand that the correlation between the percentage of Sub-Saharan Africans and poverty level among males does not imply a direct cause-and-effect relationship. It remains uncertain whether the presence of Sub-Saharan Africans influences an upward or downward trend in the level of poverty level among males within an area, or if Sub-Saharan Africans simply ended up residing in those areas with higher or lower levels of poverty level among males due to other factors.
Demographics Similar to Sub-Saharan Africans by Male Poverty
In terms of male poverty, the demographic groups most similar to Sub-Saharan Africans are Immigrants from Jamaica (13.3%, a difference of 0.030%), Immigrants from Guyana (13.2%, a difference of 0.14%), Guyanese (13.3%, a difference of 0.22%), Jamaican (13.2%, a difference of 0.28%), and Iroquois (13.2%, a difference of 0.30%).
| Demographics | Rating | Rank | Male Poverty |
| Trinidadians and Tobagonians | 0.1 /100 | #261 | Tragic 13.1% |
| Spanish American Indians | 0.1 /100 | #262 | Tragic 13.1% |
| Central Americans | 0.1 /100 | #263 | Tragic 13.2% |
| Iroquois | 0.1 /100 | #264 | Tragic 13.2% |
| Jamaicans | 0.1 /100 | #265 | Tragic 13.2% |
| Immigrants from Guyana | 0.1 /100 | #266 | Tragic 13.2% |
| Immigrants from Jamaica | 0.1 /100 | #267 | Tragic 13.3% |
| Sub-Saharan Africans | 0.1 /100 | #268 | Tragic 13.3% |
| Guyanese | 0.0 /100 | #269 | Tragic 13.3% |
| Cree | 0.0 /100 | #270 | Tragic 13.3% |
| Spanish Americans | 0.0 /100 | #271 | Tragic 13.4% |
| Immigrants from Bahamas | 0.0 /100 | #272 | Tragic 13.5% |
| Chickasaw | 0.0 /100 | #273 | Tragic 13.5% |
| Immigrants from West Indies | 0.0 /100 | #274 | Tragic 13.5% |
| Barbadians | 0.0 /100 | #275 | Tragic 13.6% |
Subsaharan African Male Poverty Correlation Summary
| Measurement | Subsaharan African Data | Male Poverty Data |
| Minimum | 0.24% | 0.81% |
| Maximum | 100.0% | 100.0% |
| Range | 99.8% | 99.2% |
| Mean | 22.9% | 20.0% |
| Median | 18.4% | 13.9% |
| Interquartile 25% (IQ1) | 9.3% | 12.3% |
| Interquartile 75% (IQ3) | 30.7% | 19.8% |
| Interquartile Range (IQR) | 21.5% | 7.6% |
| Standard Deviation (Sample) | 18.8% | 17.2% |
| Standard Deviation (Population) | 18.7% | 17.0% |
Correlation Details
| Subsaharan African Percentile | Sample Size | Male Poverty |
[ 0.0% - 0.5% ] 0.24% | 172,276,576 | 11.0% |
[ 0.5% - 1.0% ] 0.72% | 106,905,362 | 11.5% |
[ 1.0% - 1.5% ] 1.24% | 70,618,887 | 12.7% |
[ 1.5% - 2.0% ] 1.73% | 41,191,360 | 13.1% |
[ 2.0% - 2.5% ] 2.25% | 34,262,057 | 13.5% |
[ 2.5% - 3.0% ] 2.73% | 23,383,465 | 14.4% |
[ 3.0% - 3.5% ] 3.23% | 13,222,988 | 13.4% |
[ 3.5% - 4.0% ] 3.75% | 9,272,525 | 13.4% |
[ 4.0% - 4.5% ] 4.22% | 8,848,842 | 13.1% |
[ 4.5% - 5.0% ] 4.71% | 4,047,407 | 12.5% |
[ 5.0% - 5.5% ] 5.29% | 3,766,021 | 13.4% |
[ 5.5% - 6.0% ] 5.77% | 3,288,118 | 13.8% |
[ 6.0% - 6.5% ] 6.26% | 2,196,104 | 14.7% |
[ 6.5% - 7.0% ] 6.66% | 2,513,961 | 14.2% |
[ 7.0% - 7.5% ] 7.34% | 1,484,941 | 14.1% |
[ 7.5% - 8.0% ] 7.73% | 1,547,479 | 14.9% |
[ 8.0% - 8.5% ] 8.23% | 988,864 | 18.0% |
[ 8.5% - 9.0% ] 8.72% | 992,684 | 13.1% |
[ 9.0% - 9.5% ] 9.27% | 862,309 | 14.8% |
[ 9.5% - 10.0% ] 9.78% | 413,013 | 13.1% |
[ 10.0% - 10.5% ] 10.22% | 752,877 | 19.1% |
[ 10.5% - 11.0% ] 10.78% | 528,581 | 12.8% |
[ 11.0% - 11.5% ] 11.27% | 648,007 | 12.4% |
[ 11.5% - 12.0% ] 11.75% | 279,205 | 9.8% |
[ 12.0% - 12.5% ] 12.27% | 100,351 | 19.8% |
[ 12.5% - 13.0% ] 12.77% | 185,037 | 10.3% |
[ 13.0% - 13.5% ] 13.23% | 435,973 | 10.6% |
[ 13.5% - 14.0% ] 13.92% | 340,002 | 11.5% |
[ 14.0% - 14.5% ] 14.38% | 83,868 | 16.2% |
[ 14.5% - 15.0% ] 14.81% | 134,427 | 13.3% |
[ 15.0% - 15.5% ] 15.22% | 236,677 | 13.7% |
[ 15.5% - 16.0% ] 15.84% | 217,889 | 12.3% |
[ 16.0% - 16.5% ] 16.25% | 194,429 | 16.3% |
[ 16.5% - 17.0% ] 16.91% | 30,595 | 9.5% |
[ 17.0% - 17.5% ] 17.26% | 145,945 | 12.8% |
[ 17.5% - 18.0% ] 17.73% | 65,973 | 7.0% |
[ 18.0% - 18.5% ] 18.20% | 221,308 | 18.6% |
[ 18.5% - 19.0% ] 18.66% | 97,301 | 14.4% |
[ 19.0% - 19.5% ] 19.43% | 243,304 | 10.9% |
[ 19.5% - 20.0% ] 19.74% | 19,194 | 10.4% |
[ 20.0% - 20.5% ] 20.40% | 38,685 | 13.4% |
[ 20.5% - 21.0% ] 20.73% | 34,807 | 13.6% |
[ 21.0% - 21.5% ] 21.30% | 28,219 | 15.8% |
[ 21.5% - 22.0% ] 21.65% | 54,524 | 20.7% |
[ 22.0% - 22.5% ] 22.26% | 283 | 13.9% |
[ 22.5% - 23.0% ] 22.71% | 51,871 | 11.7% |
[ 23.5% - 24.0% ] 23.99% | 14,696 | 27.9% |
[ 24.0% - 24.5% ] 24.44% | 25,234 | 24.9% |
[ 24.5% - 25.0% ] 24.91% | 273 | 33.7% |
[ 25.5% - 26.0% ] 25.54% | 881 | 3.2% |
[ 26.0% - 26.5% ] 26.24% | 2,138 | 39.5% |
[ 27.5% - 28.0% ] 27.93% | 512 | 29.6% |
[ 28.0% - 28.5% ] 28.06% | 29,898 | 27.8% |
[ 29.5% - 30.0% ] 29.55% | 44 | 14.8% |
[ 30.0% - 30.5% ] 30.12% | 1,932 | 19.1% |
[ 30.5% - 31.0% ] 30.74% | 15,489 | 14.3% |
[ 31.0% - 31.5% ] 31.35% | 2,485 | 7.8% |
[ 32.5% - 33.0% ] 32.93% | 334 | 17.0% |
[ 33.5% - 34.0% ] 33.53% | 173 | 25.0% |
[ 34.0% - 34.5% ] 34.07% | 3,824 | 10.0% |
[ 35.0% - 35.5% ] 35.23% | 1,286 | 11.1% |
[ 40.0% - 40.5% ] 40.22% | 4,572 | 0.81% |
[ 40.5% - 41.0% ] 40.56% | 9,613 | 30.2% |
[ 41.5% - 42.0% ] 41.76% | 613 | 36.5% |
[ 43.0% - 43.5% ] 43.29% | 633 | 25.4% |
[ 47.0% - 47.5% ] 47.10% | 1,157 | 35.3% |
[ 49.0% - 49.5% ] 49.01% | 8,892 | 49.1% |
[ 54.5% - 55.0% ] 54.55% | 11 | 75.0% |
[ 55.0% - 55.5% ] 55.41% | 231 | 69.5% |
[ 58.0% - 58.5% ] 58.19% | 574 | 5.0% |
[ 59.0% - 59.5% ] 59.02% | 549 | 9.0% |
[ 65.5% - 66.0% ] 65.55% | 479 | 41.2% |
[ 68.5% - 69.0% ] 68.60% | 86 | 76.7% |
[ 99.5% - 100.0% ] 100.00% | 32 | 100.0% |