Subsaharan African vs Immigrants from Eritrea Married-couple Households
COMPARE
Subsaharan African
Immigrants from Eritrea
Married-couple Households
Married-couple Households Comparison
Sub-Saharan Africans
Immigrants from Eritrea
41.6%
MARRIED-COUPLE HOUSEHOLDS
0.0/ 100
METRIC RATING
303rd/ 347
METRIC RANK
42.1%
MARRIED-COUPLE HOUSEHOLDS
0.0/ 100
METRIC RATING
288th/ 347
METRIC RANK
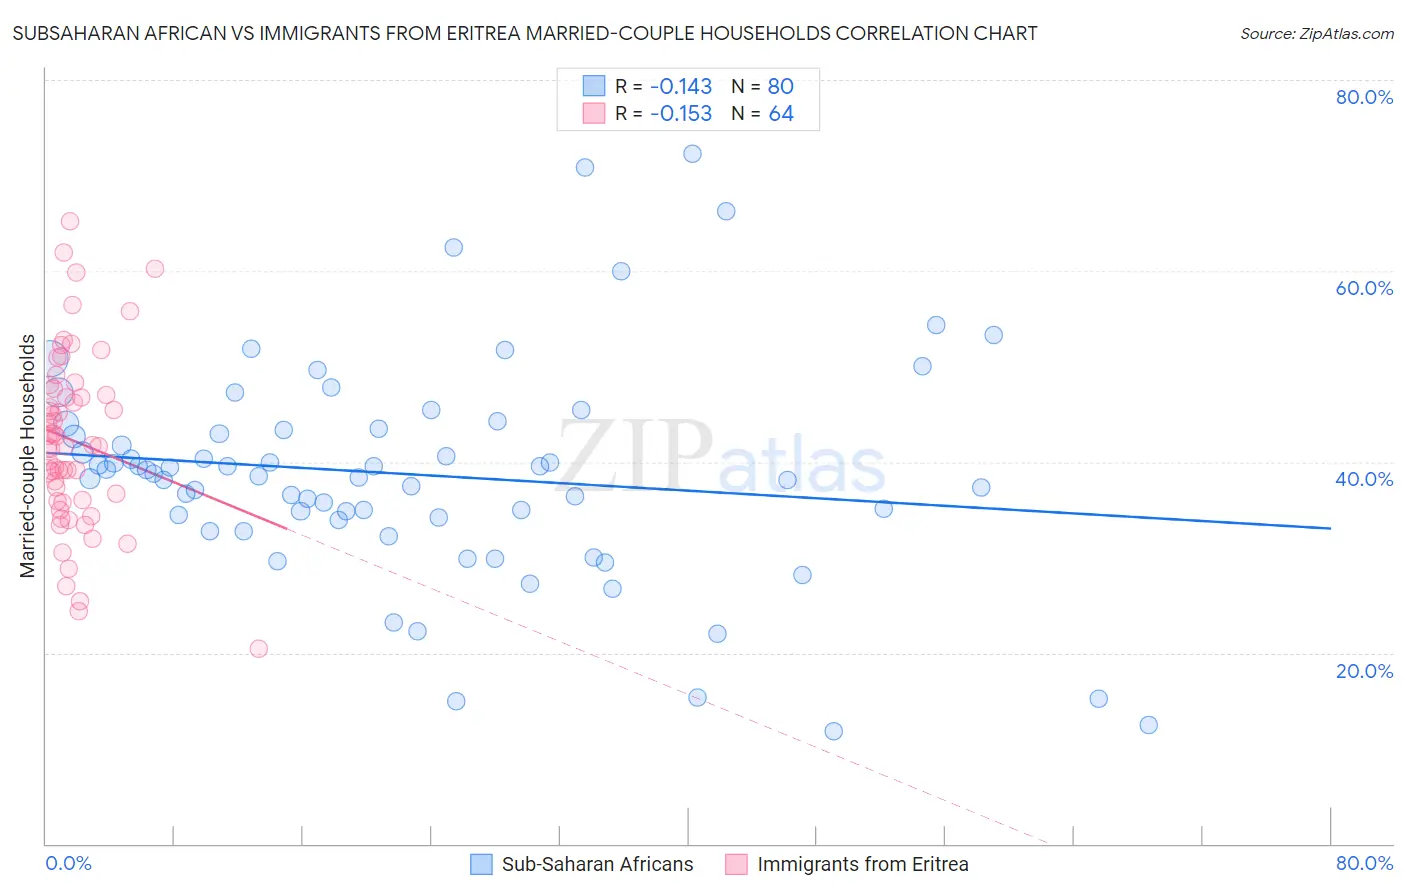
Subsaharan African vs Immigrants from Eritrea Married-couple Households Correlation Chart
The statistical analysis conducted on geographies consisting of 507,572,233 people shows a poor negative correlation between the proportion of Sub-Saharan Africans and percentage of married-couple family households in the United States with a correlation coefficient (R) of -0.143 and weighted average of 41.6%. Similarly, the statistical analysis conducted on geographies consisting of 104,844,596 people shows a poor negative correlation between the proportion of Immigrants from Eritrea and percentage of married-couple family households in the United States with a correlation coefficient (R) of -0.153 and weighted average of 42.1%, a difference of 1.2%.
Married-couple Households Correlation Summary
| Measurement | Subsaharan African | Immigrants from Eritrea |
| Minimum | 11.8% | 20.5% |
| Maximum | 72.3% | 65.2% |
| Range | 60.5% | 44.8% |
| Mean | 38.7% | 42.2% |
| Median | 38.6% | 41.7% |
| Interquartile 25% (IQ1) | 34.1% | 35.9% |
| Interquartile 75% (IQ3) | 43.4% | 47.4% |
| Interquartile Range (IQR) | 9.3% | 11.5% |
| Standard Deviation (Sample) | 11.6% | 9.2% |
| Standard Deviation (Population) | 11.5% | 9.1% |
Demographics Similar to Sub-Saharan Africans and Immigrants from Eritrea by Married-couple Households
In terms of married-couple households, the demographic groups most similar to Sub-Saharan Africans are Immigrants from Honduras (41.6%, a difference of 0.0%), Immigrants from Guyana (41.6%, a difference of 0.11%), Immigrants from Bahamas (41.7%, a difference of 0.18%), Sioux (41.5%, a difference of 0.22%), and Immigrants from Belize (41.8%, a difference of 0.39%). Similarly, the demographic groups most similar to Immigrants from Eritrea are Sudanese (42.1%, a difference of 0.060%), Chippewa (42.1%, a difference of 0.080%), Honduran (42.1%, a difference of 0.11%), Paiute (42.1%, a difference of 0.11%), and Indonesian (42.0%, a difference of 0.16%).
| Demographics | Rating | Rank | Married-couple Households |
| Ghanaians | 0.0 /100 | #285 | Tragic 42.2% |
| Belizeans | 0.0 /100 | #286 | Tragic 42.2% |
| Chippewa | 0.0 /100 | #287 | Tragic 42.1% |
| Immigrants | Eritrea | 0.0 /100 | #288 | Tragic 42.1% |
| Sudanese | 0.0 /100 | #289 | Tragic 42.1% |
| Hondurans | 0.0 /100 | #290 | Tragic 42.1% |
| Paiute | 0.0 /100 | #291 | Tragic 42.1% |
| Indonesians | 0.0 /100 | #292 | Tragic 42.0% |
| Menominee | 0.0 /100 | #293 | Tragic 42.0% |
| Immigrants | Yemen | 0.0 /100 | #294 | Tragic 42.0% |
| Kiowa | 0.0 /100 | #295 | Tragic 42.0% |
| Immigrants | Sudan | 0.0 /100 | #296 | Tragic 41.9% |
| Arapaho | 0.0 /100 | #297 | Tragic 41.8% |
| Immigrants | Middle Africa | 0.0 /100 | #298 | Tragic 41.8% |
| Immigrants | Ghana | 0.0 /100 | #299 | Tragic 41.8% |
| Immigrants | Belize | 0.0 /100 | #300 | Tragic 41.8% |
| Immigrants | Bahamas | 0.0 /100 | #301 | Tragic 41.7% |
| Immigrants | Honduras | 0.0 /100 | #302 | Tragic 41.6% |
| Sub-Saharan Africans | 0.0 /100 | #303 | Tragic 41.6% |
| Immigrants | Guyana | 0.0 /100 | #304 | Tragic 41.6% |
| Sioux | 0.0 /100 | #305 | Tragic 41.5% |