Subsaharan African Unemployment
COMPARE
Subsaharan African
Select to Compare
Unemployment
Subsaharan African Unemployment
5.8%
UNEMPLOYMENT
0.1/ 100
METRIC RATING
259th/ 347
METRIC RANK
Subsaharan African Unemployment Correlation Chart
The statistical analysis conducted on geographies consisting of 507,124,054 people shows a moderate positive correlation between the proportion of Sub-Saharan Africans and unemployment in the United States with a correlation coefficient (R) of 0.453 and weighted average of 5.8%. On average, for every 1% (one percent) increase in Sub-Saharan Africans within a typical geography, there is an increase of 0.21% in unemployment.
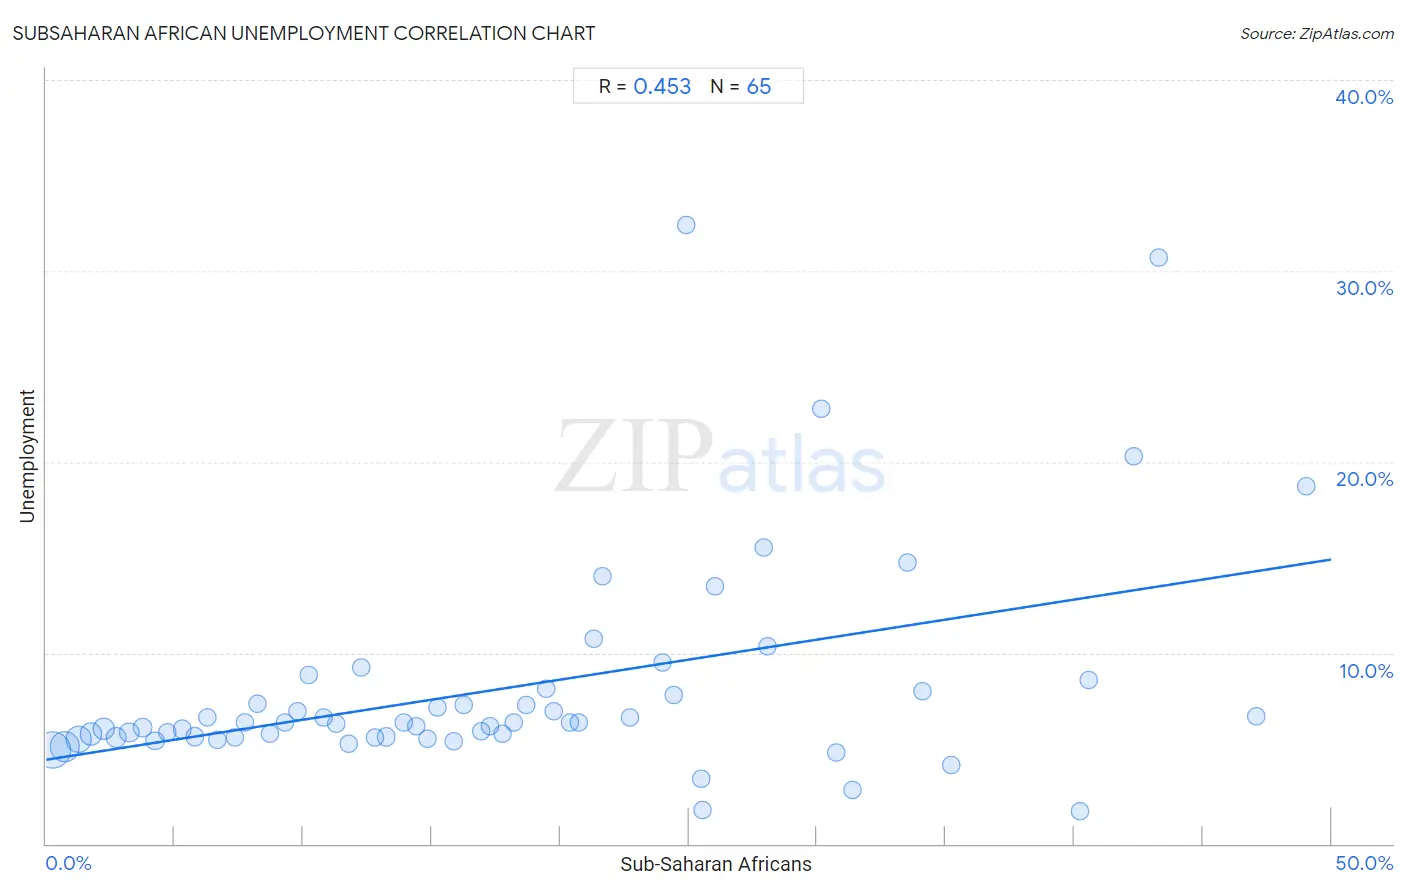
It is essential to understand that the correlation between the percentage of Sub-Saharan Africans and unemployment does not imply a direct cause-and-effect relationship. It remains uncertain whether the presence of Sub-Saharan Africans influences an upward or downward trend in the level of unemployment within an area, or if Sub-Saharan Africans simply ended up residing in those areas with higher or lower levels of unemployment due to other factors.
Demographics Similar to Sub-Saharan Africans by Unemployment
In terms of unemployment, the demographic groups most similar to Sub-Saharan Africans are Immigrants from Uzbekistan (5.8%, a difference of 0.020%), Immigrants from Guatemala (5.8%, a difference of 0.040%), Immigrants from Bahamas (5.8%, a difference of 0.12%), Sierra Leonean (5.8%, a difference of 0.14%), and Salvadoran (5.8%, a difference of 0.17%).
| Demographics | Rating | Rank | Unemployment |
| Hondurans | 0.3 /100 | #252 | Tragic 5.7% |
| Central Americans | 0.3 /100 | #253 | Tragic 5.7% |
| Immigrants from Honduras | 0.3 /100 | #254 | Tragic 5.7% |
| Immigrants from Portugal | 0.2 /100 | #255 | Tragic 5.7% |
| Guatemalans | 0.2 /100 | #256 | Tragic 5.8% |
| Yaqui | 0.2 /100 | #257 | Tragic 5.8% |
| Immigrants from Bahamas | 0.1 /100 | #258 | Tragic 5.8% |
| Sub-Saharan Africans | 0.1 /100 | #259 | Tragic 5.8% |
| Immigrants from Uzbekistan | 0.1 /100 | #260 | Tragic 5.8% |
| Immigrants from Guatemala | 0.1 /100 | #261 | Tragic 5.8% |
| Sierra Leoneans | 0.1 /100 | #262 | Tragic 5.8% |
| Salvadorans | 0.1 /100 | #263 | Tragic 5.8% |
| Immigrants from Liberia | 0.1 /100 | #264 | Tragic 5.8% |
| Nigerians | 0.1 /100 | #265 | Tragic 5.8% |
| Mexican American Indians | 0.1 /100 | #266 | Tragic 5.8% |
Subsaharan African Unemployment Correlation Summary
| Measurement | Subsaharan African Data | Unemployment Data |
| Minimum | 0.24% | 1.7% |
| Maximum | 49.0% | 32.4% |
| Range | 48.8% | 30.7% |
| Mean | 18.0% | 8.2% |
| Median | 16.3% | 6.3% |
| Interquartile 25% (IQ1) | 8.0% | 5.6% |
| Interquartile 75% (IQ3) | 25.5% | 8.0% |
| Interquartile Range (IQR) | 17.5% | 2.5% |
| Standard Deviation (Sample) | 12.4% | 5.7% |
| Standard Deviation (Population) | 12.3% | 5.7% |
Correlation Details
| Subsaharan African Percentile | Sample Size | Unemployment |
[ 0.0% - 0.5% ] 0.24% | 172,111,604 | 4.9% |
[ 0.5% - 1.0% ] 0.72% | 106,799,244 | 5.1% |
[ 1.0% - 1.5% ] 1.24% | 70,618,903 | 5.5% |
[ 1.5% - 2.0% ] 1.73% | 41,211,390 | 5.7% |
[ 2.0% - 2.5% ] 2.25% | 34,257,598 | 6.0% |
[ 2.5% - 3.0% ] 2.73% | 23,392,815 | 5.6% |
[ 3.0% - 3.5% ] 3.23% | 13,221,820 | 5.8% |
[ 3.5% - 4.0% ] 3.75% | 9,288,123 | 6.1% |
[ 4.0% - 4.5% ] 4.22% | 8,845,702 | 5.4% |
[ 4.5% - 5.0% ] 4.71% | 4,047,589 | 5.8% |
[ 5.0% - 5.5% ] 5.29% | 3,770,898 | 6.0% |
[ 5.5% - 6.0% ] 5.77% | 3,280,643 | 5.6% |
[ 6.0% - 6.5% ] 6.26% | 2,196,364 | 6.6% |
[ 6.5% - 7.0% ] 6.66% | 2,511,046 | 5.4% |
[ 7.0% - 7.5% ] 7.34% | 1,484,873 | 5.6% |
[ 7.5% - 8.0% ] 7.73% | 1,548,754 | 6.3% |
[ 8.0% - 8.5% ] 8.23% | 989,483 | 7.3% |
[ 8.5% - 9.0% ] 8.72% | 988,654 | 5.8% |
[ 9.0% - 9.5% ] 9.27% | 869,196 | 6.3% |
[ 9.5% - 10.0% ] 9.78% | 412,718 | 6.9% |
[ 10.0% - 10.5% ] 10.22% | 751,286 | 8.8% |
[ 10.5% - 11.0% ] 10.78% | 525,220 | 6.6% |
[ 11.0% - 11.5% ] 11.27% | 650,674 | 6.3% |
[ 11.5% - 12.0% ] 11.75% | 276,124 | 5.2% |
[ 12.0% - 12.5% ] 12.27% | 99,253 | 9.2% |
[ 12.5% - 13.0% ] 12.77% | 182,061 | 5.5% |
[ 13.0% - 13.5% ] 13.23% | 435,973 | 5.6% |
[ 13.5% - 14.0% ] 13.92% | 339,977 | 6.3% |
[ 14.0% - 14.5% ] 14.38% | 83,148 | 6.2% |
[ 14.5% - 15.0% ] 14.81% | 133,067 | 5.5% |
[ 15.0% - 15.5% ] 15.22% | 236,255 | 7.1% |
[ 15.5% - 16.0% ] 15.84% | 217,851 | 5.4% |
[ 16.0% - 16.5% ] 16.25% | 194,091 | 7.3% |
[ 16.5% - 17.0% ] 16.91% | 29,350 | 5.9% |
[ 17.0% - 17.5% ] 17.26% | 145,391 | 6.2% |
[ 17.5% - 18.0% ] 17.73% | 65,899 | 5.8% |
[ 18.0% - 18.5% ] 18.20% | 220,571 | 6.3% |
[ 18.5% - 19.0% ] 18.66% | 97,301 | 7.3% |
[ 19.0% - 19.5% ] 19.43% | 243,201 | 8.1% |
[ 19.5% - 20.0% ] 19.74% | 19,739 | 7.0% |
[ 20.0% - 20.5% ] 20.40% | 38,685 | 6.3% |
[ 20.5% - 21.0% ] 20.73% | 34,686 | 6.3% |
[ 21.0% - 21.5% ] 21.30% | 28,219 | 10.7% |
[ 21.5% - 22.0% ] 21.65% | 54,524 | 14.0% |
[ 22.5% - 23.0% ] 22.71% | 50,775 | 6.6% |
[ 23.5% - 24.0% ] 23.99% | 14,696 | 9.5% |
[ 24.0% - 24.5% ] 24.44% | 25,234 | 7.8% |
[ 24.5% - 25.0% ] 24.91% | 273 | 32.4% |
[ 25.0% - 25.5% ] 25.47% | 267 | 3.4% |
[ 25.5% - 26.0% ] 25.54% | 881 | 1.8% |
[ 26.0% - 26.5% ] 26.04% | 1,056 | 13.5% |
[ 27.5% - 28.0% ] 27.93% | 512 | 15.5% |
[ 28.0% - 28.5% ] 28.06% | 29,898 | 10.4% |
[ 30.0% - 30.5% ] 30.14% | 2,037 | 22.8% |
[ 30.5% - 31.0% ] 30.74% | 15,489 | 4.8% |
[ 31.0% - 31.5% ] 31.35% | 2,485 | 2.8% |
[ 33.5% - 34.0% ] 33.53% | 173 | 14.7% |
[ 34.0% - 34.5% ] 34.07% | 3,824 | 8.0% |
[ 35.0% - 35.5% ] 35.23% | 1,286 | 4.1% |
[ 40.0% - 40.5% ] 40.22% | 4,572 | 1.7% |
[ 40.5% - 41.0% ] 40.56% | 9,613 | 8.6% |
[ 42.0% - 42.5% ] 42.31% | 338 | 20.3% |
[ 43.0% - 43.5% ] 43.29% | 633 | 30.7% |
[ 47.0% - 47.5% ] 47.10% | 1,157 | 6.7% |
[ 49.0% - 49.5% ] 49.01% | 8,892 | 18.7% |