Subsaharan African Divorced or Separated
COMPARE
Subsaharan African
Select to Compare
Divorced or Separated
Subsaharan African Divorced or Separated
12.7%
DIVORCED OR SEPARATED
0.1/ 100
METRIC RATING
282nd/ 347
METRIC RANK
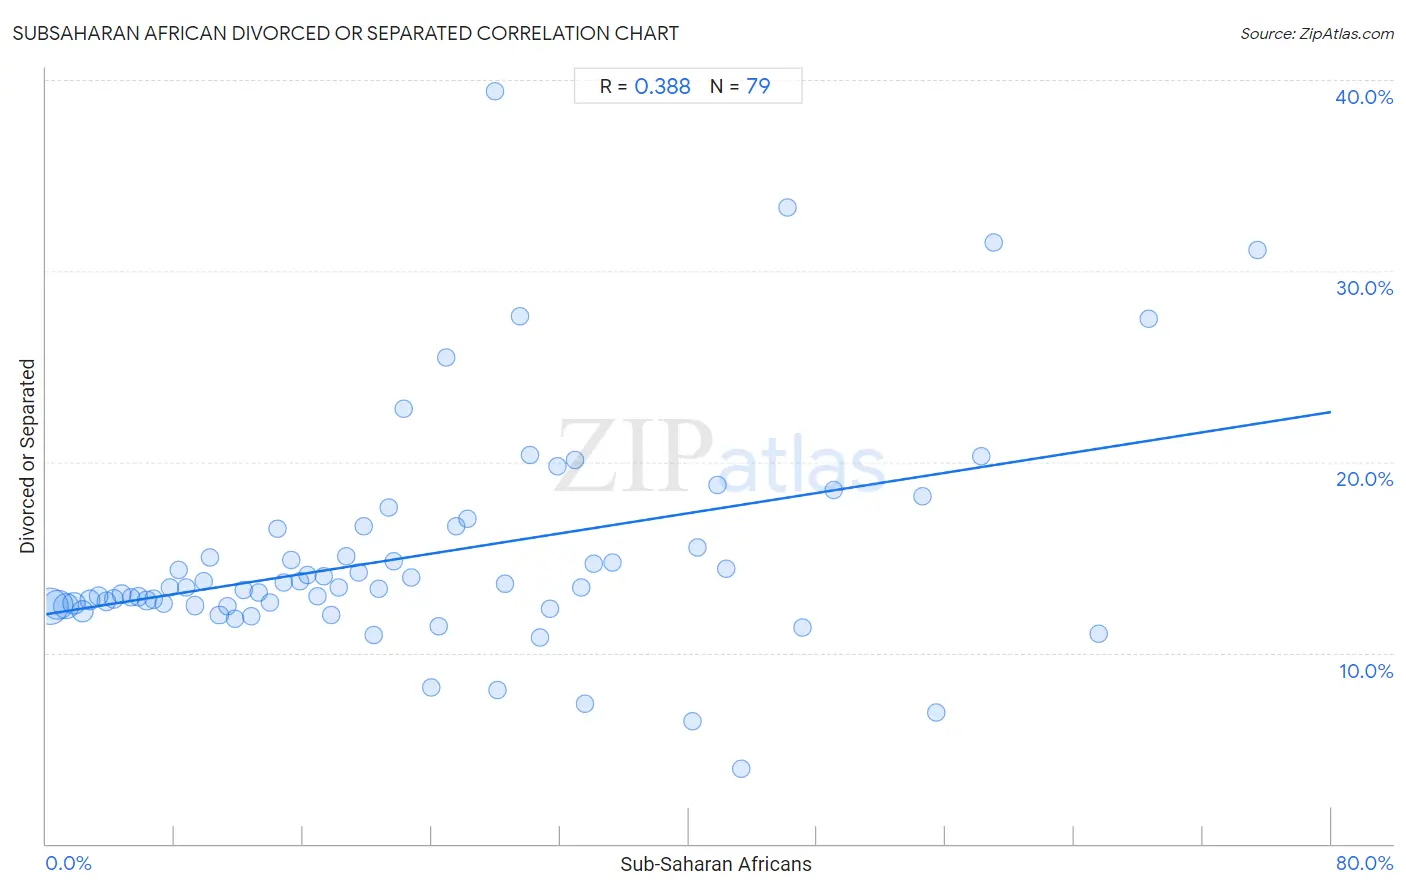
Subsaharan African Divorced or Separated Correlation Chart
The statistical analysis conducted on geographies consisting of 507,827,607 people shows a mild positive correlation between the proportion of Sub-Saharan Africans and percentage of population currently divorced or separated in the United States with a correlation coefficient (R) of 0.388 and weighted average of 12.7%. On average, for every 1% (one percent) increase in Sub-Saharan Africans within a typical geography, there is an increase of 0.13% in percentage of population currently divorced or separated.
It is essential to understand that the correlation between the percentage of Sub-Saharan Africans and percentage of population currently divorced or separated does not imply a direct cause-and-effect relationship. It remains uncertain whether the presence of Sub-Saharan Africans influences an upward or downward trend in the level of percentage of population currently divorced or separated within an area, or if Sub-Saharan Africans simply ended up residing in those areas with higher or lower levels of percentage of population currently divorced or separated due to other factors.
Demographics Similar to Sub-Saharan Africans by Divorced or Separated
In terms of divorced or separated, the demographic groups most similar to Sub-Saharan Africans are Delaware (12.7%, a difference of 0.010%), Nonimmigrants (12.8%, a difference of 0.10%), Pueblo (12.7%, a difference of 0.12%), French (12.8%, a difference of 0.14%), and Immigrants from Zaire (12.7%, a difference of 0.16%).
| Demographics | Rating | Rank | Divorced or Separated |
| Central American Indians | 0.3 /100 | #275 | Tragic 12.7% |
| Spaniards | 0.2 /100 | #276 | Tragic 12.7% |
| Dominicans | 0.2 /100 | #277 | Tragic 12.7% |
| Lumbee | 0.2 /100 | #278 | Tragic 12.7% |
| Immigrants from Dominican Republic | 0.2 /100 | #279 | Tragic 12.7% |
| Immigrants from Zaire | 0.2 /100 | #280 | Tragic 12.7% |
| Pueblo | 0.2 /100 | #281 | Tragic 12.7% |
| Sub-Saharan Africans | 0.1 /100 | #282 | Tragic 12.7% |
| Delaware | 0.1 /100 | #283 | Tragic 12.7% |
| Nonimmigrants | 0.1 /100 | #284 | Tragic 12.8% |
| French | 0.1 /100 | #285 | Tragic 12.8% |
| Spanish | 0.1 /100 | #286 | Tragic 12.8% |
| Hondurans | 0.1 /100 | #287 | Tragic 12.8% |
| French Canadians | 0.1 /100 | #288 | Tragic 12.8% |
| Iroquois | 0.0 /100 | #289 | Tragic 12.9% |
Subsaharan African Divorced or Separated Correlation Summary
| Measurement | Subsaharan African Data | Divorced or Separated Data |
| Minimum | 0.24% | 3.9% |
| Maximum | 75.4% | 39.4% |
| Range | 75.2% | 35.5% |
| Mean | 23.4% | 15.1% |
| Median | 19.7% | 13.4% |
| Interquartile 25% (IQ1) | 9.8% | 12.5% |
| Interquartile 75% (IQ3) | 32.9% | 16.5% |
| Interquartile Range (IQR) | 23.2% | 4.0% |
| Standard Deviation (Sample) | 17.5% | 6.0% |
| Standard Deviation (Population) | 17.4% | 5.9% |
Correlation Details
| Subsaharan African Percentile | Sample Size | Divorced or Separated |
[ 0.0% - 0.5% ] 0.24% | 172,369,376 | 12.5% |
[ 0.5% - 1.0% ] 0.72% | 106,956,524 | 12.5% |
[ 1.0% - 1.5% ] 1.24% | 70,650,980 | 12.5% |
[ 1.5% - 2.0% ] 1.73% | 41,262,672 | 12.6% |
[ 2.0% - 2.5% ] 2.25% | 34,289,842 | 12.2% |
[ 2.5% - 3.0% ] 2.73% | 23,410,356 | 12.8% |
[ 3.0% - 3.5% ] 3.23% | 13,233,302 | 13.0% |
[ 3.5% - 4.0% ] 3.75% | 9,300,440 | 12.7% |
[ 4.0% - 4.5% ] 4.22% | 8,860,165 | 12.8% |
[ 4.5% - 5.0% ] 4.71% | 4,066,260 | 13.1% |
[ 5.0% - 5.5% ] 5.29% | 3,785,984 | 12.9% |
[ 5.5% - 6.0% ] 5.77% | 3,290,015 | 12.9% |
[ 6.0% - 6.5% ] 6.26% | 2,200,977 | 12.7% |
[ 6.5% - 7.0% ] 6.66% | 2,518,123 | 12.8% |
[ 7.0% - 7.5% ] 7.34% | 1,487,320 | 12.6% |
[ 7.5% - 8.0% ] 7.73% | 1,552,061 | 13.4% |
[ 8.0% - 8.5% ] 8.23% | 991,208 | 14.3% |
[ 8.5% - 9.0% ] 8.72% | 992,684 | 13.4% |
[ 9.0% - 9.5% ] 9.27% | 869,744 | 12.5% |
[ 9.5% - 10.0% ] 9.78% | 413,340 | 13.8% |
[ 10.0% - 10.5% ] 10.22% | 753,829 | 15.0% |
[ 10.5% - 11.0% ] 10.78% | 529,116 | 12.0% |
[ 11.0% - 11.5% ] 11.27% | 653,154 | 12.4% |
[ 11.5% - 12.0% ] 11.75% | 279,205 | 11.8% |
[ 12.0% - 12.5% ] 12.27% | 100,912 | 13.3% |
[ 12.5% - 13.0% ] 12.77% | 185,624 | 11.9% |
[ 13.0% - 13.5% ] 13.23% | 438,997 | 13.2% |
[ 13.5% - 14.0% ] 13.91% | 351,400 | 12.6% |
[ 14.0% - 14.5% ] 14.38% | 83,868 | 16.5% |
[ 14.5% - 15.0% ] 14.81% | 134,427 | 13.7% |
[ 15.0% - 15.5% ] 15.22% | 236,677 | 14.9% |
[ 15.5% - 16.0% ] 15.83% | 220,043 | 13.8% |
[ 16.0% - 16.5% ] 16.25% | 194,496 | 14.1% |
[ 16.5% - 17.0% ] 16.91% | 30,595 | 13.0% |
[ 17.0% - 17.5% ] 17.26% | 145,945 | 14.0% |
[ 17.5% - 18.0% ] 17.73% | 65,899 | 12.0% |
[ 18.0% - 18.5% ] 18.20% | 221,484 | 13.4% |
[ 18.5% - 19.0% ] 18.66% | 97,301 | 15.1% |
[ 19.0% - 19.5% ] 19.43% | 243,304 | 14.2% |
[ 19.5% - 20.0% ] 19.74% | 20,175 | 16.6% |
[ 20.0% - 20.5% ] 20.40% | 38,846 | 11.0% |
[ 20.5% - 21.0% ] 20.73% | 34,831 | 13.4% |
[ 21.0% - 21.5% ] 21.30% | 28,219 | 17.6% |
[ 21.5% - 22.0% ] 21.65% | 54,524 | 14.8% |
[ 22.0% - 22.5% ] 22.26% | 283 | 22.8% |
[ 22.5% - 23.0% ] 22.71% | 51,871 | 13.9% |
[ 23.5% - 24.0% ] 23.99% | 14,696 | 8.2% |
[ 24.0% - 24.5% ] 24.43% | 25,333 | 11.4% |
[ 24.5% - 25.0% ] 24.86% | 370 | 25.5% |
[ 25.5% - 26.0% ] 25.54% | 881 | 16.6% |
[ 26.0% - 26.5% ] 26.24% | 2,138 | 17.0% |
[ 27.5% - 28.0% ] 27.93% | 512 | 39.4% |
[ 28.0% - 28.5% ] 28.06% | 29,898 | 8.1% |
[ 28.5% - 29.0% ] 28.57% | 154 | 13.6% |
[ 29.5% - 30.0% ] 29.53% | 2,313 | 27.6% |
[ 30.0% - 30.5% ] 30.12% | 1,932 | 20.4% |
[ 30.5% - 31.0% ] 30.74% | 15,489 | 10.8% |
[ 31.0% - 31.5% ] 31.35% | 2,485 | 12.3% |
[ 31.5% - 32.0% ] 31.81% | 1,311 | 19.8% |
[ 32.5% - 33.0% ] 32.93% | 334 | 20.1% |
[ 33.0% - 33.5% ] 33.33% | 15 | 13.4% |
[ 33.5% - 34.0% ] 33.53% | 173 | 7.3% |
[ 34.0% - 34.5% ] 34.07% | 3,824 | 14.7% |
[ 35.0% - 35.5% ] 35.23% | 1,286 | 14.7% |
[ 40.0% - 40.5% ] 40.22% | 4,572 | 6.4% |
[ 40.5% - 41.0% ] 40.56% | 9,613 | 15.5% |
[ 41.5% - 42.0% ] 41.76% | 613 | 18.8% |
[ 42.0% - 42.5% ] 42.31% | 338 | 14.4% |
[ 43.0% - 43.5% ] 43.29% | 633 | 3.9% |
[ 46.0% - 46.5% ] 46.15% | 78 | 33.3% |
[ 47.0% - 47.5% ] 47.10% | 1,157 | 11.3% |
[ 49.0% - 49.5% ] 49.02% | 9,074 | 18.5% |
[ 54.5% - 55.0% ] 54.55% | 11 | 18.2% |
[ 55.0% - 55.5% ] 55.41% | 231 | 6.9% |
[ 58.0% - 58.5% ] 58.19% | 574 | 20.3% |
[ 59.0% - 59.5% ] 59.02% | 549 | 31.5% |
[ 65.5% - 66.0% ] 65.55% | 479 | 11.0% |
[ 68.5% - 69.0% ] 68.60% | 86 | 27.5% |
[ 75.0% - 75.5% ] 75.44% | 57 | 31.1% |