Subsaharan African Child Poverty Under the Age of 5
COMPARE
Subsaharan African
Select to Compare
Child Poverty Under the Age of 5
Subsaharan African Child Poverty Under the Age of 5
20.8%
POVERTY | CHILDREN < 5
0.0/ 100
METRIC RATING
279th/ 347
METRIC RANK
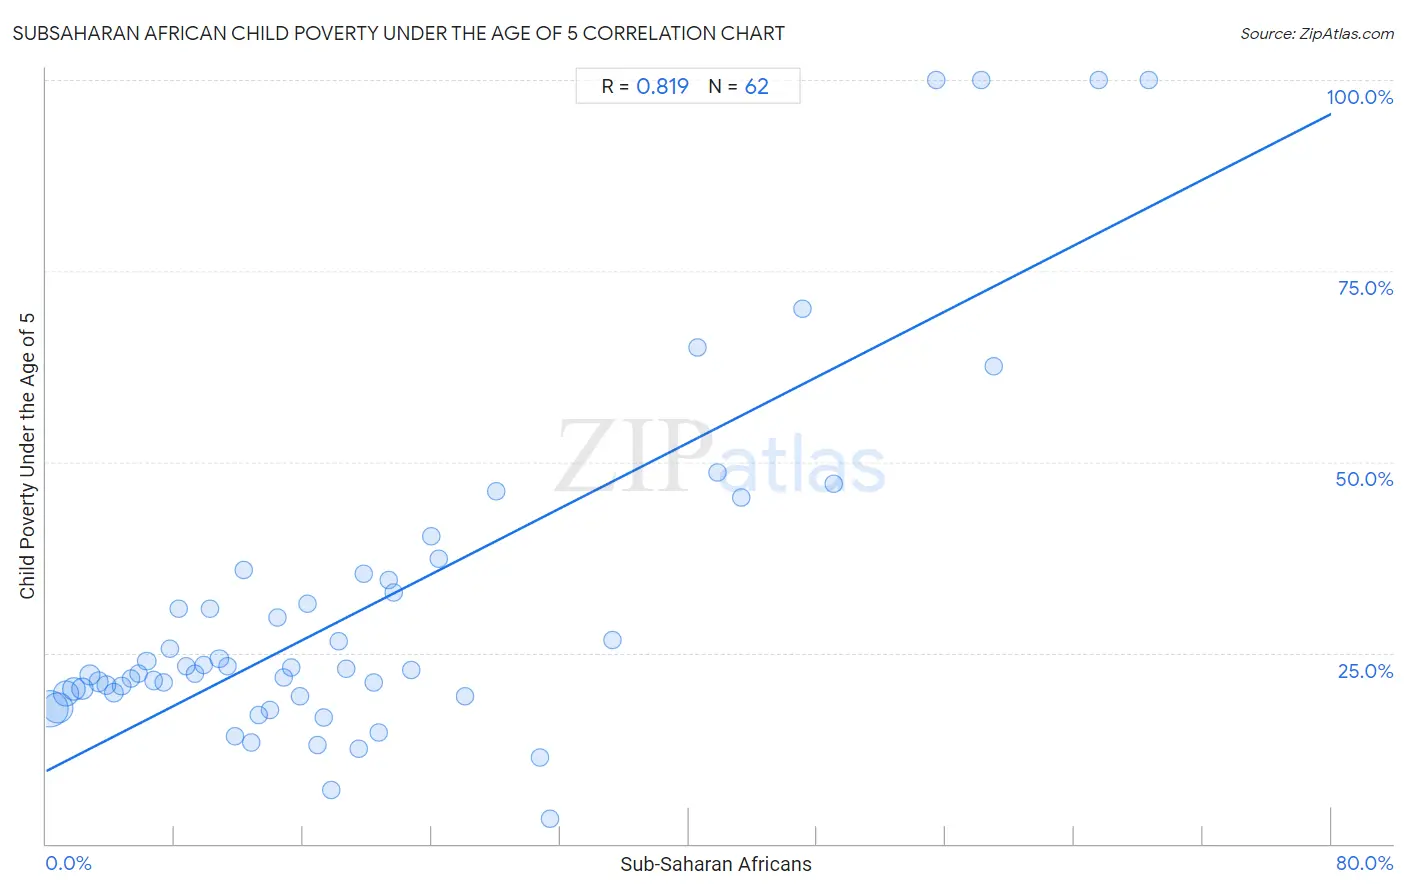
Subsaharan African Child Poverty Under the Age of 5 Correlation Chart
The statistical analysis conducted on geographies consisting of 484,697,114 people shows a very strong positive correlation between the proportion of Sub-Saharan Africans and poverty level among children under the age of 5 in the United States with a correlation coefficient (R) of 0.819 and weighted average of 20.8%. On average, for every 1% (one percent) increase in Sub-Saharan Africans within a typical geography, there is an increase of 1.1% in poverty level among children under the age of 5.
It is essential to understand that the correlation between the percentage of Sub-Saharan Africans and poverty level among children under the age of 5 does not imply a direct cause-and-effect relationship. It remains uncertain whether the presence of Sub-Saharan Africans influences an upward or downward trend in the level of poverty level among children under the age of 5 within an area, or if Sub-Saharan Africans simply ended up residing in those areas with higher or lower levels of poverty level among children under the age of 5 due to other factors.
Demographics Similar to Sub-Saharan Africans by Child Poverty Under the Age of 5
In terms of child poverty under the age of 5, the demographic groups most similar to Sub-Saharan Africans are Immigrants from Grenada (20.7%, a difference of 0.37%), Immigrants from West Indies (20.7%, a difference of 0.39%), French American Indian (20.8%, a difference of 0.41%), West Indian (20.6%, a difference of 0.56%), and Senegalese (20.9%, a difference of 0.64%).
| Demographics | Rating | Rank | Child Poverty Under the Age of 5 |
| Immigrants from Jamaica | 0.1 /100 | #272 | Tragic 20.5% |
| Central Americans | 0.1 /100 | #273 | Tragic 20.6% |
| Immigrants from Belize | 0.1 /100 | #274 | Tragic 20.6% |
| Bangladeshis | 0.1 /100 | #275 | Tragic 20.6% |
| West Indians | 0.0 /100 | #276 | Tragic 20.6% |
| Immigrants from West Indies | 0.0 /100 | #277 | Tragic 20.7% |
| Immigrants from Grenada | 0.0 /100 | #278 | Tragic 20.7% |
| Sub-Saharan Africans | 0.0 /100 | #279 | Tragic 20.8% |
| French American Indians | 0.0 /100 | #280 | Tragic 20.8% |
| Senegalese | 0.0 /100 | #281 | Tragic 20.9% |
| Potawatomi | 0.0 /100 | #282 | Tragic 21.0% |
| Comanche | 0.0 /100 | #283 | Tragic 21.0% |
| Somalis | 0.0 /100 | #284 | Tragic 21.1% |
| Haitians | 0.0 /100 | #285 | Tragic 21.2% |
| Immigrants from Latin America | 0.0 /100 | #286 | Tragic 21.2% |
Subsaharan African Child Poverty Under the Age of 5 Correlation Summary
| Measurement | Subsaharan African Data | Child Poverty Under the Age of 5 Data |
| Minimum | 0.24% | 3.3% |
| Maximum | 68.6% | 100.0% |
| Range | 68.4% | 96.7% |
| Mean | 19.9% | 30.9% |
| Median | 15.5% | 22.8% |
| Interquartile 25% (IQ1) | 7.7% | 19.6% |
| Interquartile 75% (IQ3) | 24.4% | 34.5% |
| Interquartile Range (IQR) | 16.7% | 14.9% |
| Standard Deviation (Sample) | 17.0% | 22.3% |
| Standard Deviation (Population) | 16.9% | 22.2% |
Correlation Details
| Subsaharan African Percentile | Sample Size | Child Poverty Under the Age of 5 |
[ 0.0% - 0.5% ] 0.24% | 161,510,141 | 17.6% |
[ 0.5% - 1.0% ] 0.72% | 101,630,617 | 17.8% |
[ 1.0% - 1.5% ] 1.24% | 68,252,842 | 19.6% |
[ 1.5% - 2.0% ] 1.73% | 39,814,510 | 20.2% |
[ 2.0% - 2.5% ] 2.25% | 33,604,789 | 20.3% |
[ 2.5% - 3.0% ] 2.73% | 22,868,420 | 22.2% |
[ 3.0% - 3.5% ] 3.23% | 12,787,653 | 21.2% |
[ 3.5% - 4.0% ] 3.75% | 8,974,370 | 20.7% |
[ 4.0% - 4.5% ] 4.22% | 8,741,008 | 19.8% |
[ 4.5% - 5.0% ] 4.71% | 3,911,008 | 20.7% |
[ 5.0% - 5.5% ] 5.29% | 3,625,975 | 21.7% |
[ 5.5% - 6.0% ] 5.77% | 3,191,853 | 22.3% |
[ 6.0% - 6.5% ] 6.26% | 2,126,921 | 23.9% |
[ 6.5% - 7.0% ] 6.66% | 2,481,985 | 21.4% |
[ 7.0% - 7.5% ] 7.34% | 1,459,309 | 21.1% |
[ 7.5% - 8.0% ] 7.73% | 1,470,508 | 25.6% |
[ 8.0% - 8.5% ] 8.23% | 944,841 | 30.8% |
[ 8.5% - 9.0% ] 8.72% | 982,201 | 23.2% |
[ 9.0% - 9.5% ] 9.27% | 836,718 | 22.2% |
[ 9.5% - 10.0% ] 9.79% | 379,780 | 23.4% |
[ 10.0% - 10.5% ] 10.22% | 740,582 | 30.7% |
[ 10.5% - 11.0% ] 10.78% | 518,955 | 24.3% |
[ 11.0% - 11.5% ] 11.27% | 599,754 | 23.2% |
[ 11.5% - 12.0% ] 11.74% | 262,254 | 14.0% |
[ 12.0% - 12.5% ] 12.27% | 96,712 | 35.9% |
[ 12.5% - 13.0% ] 12.77% | 172,677 | 13.3% |
[ 13.0% - 13.5% ] 13.23% | 434,970 | 16.9% |
[ 13.5% - 14.0% ] 13.92% | 339,333 | 17.5% |
[ 14.0% - 14.5% ] 14.38% | 83,590 | 29.6% |
[ 14.5% - 15.0% ] 14.82% | 117,427 | 21.7% |
[ 15.0% - 15.5% ] 15.22% | 231,880 | 23.1% |
[ 15.5% - 16.0% ] 15.83% | 211,539 | 19.3% |
[ 16.0% - 16.5% ] 16.25% | 178,847 | 31.4% |
[ 16.5% - 17.0% ] 16.92% | 24,856 | 12.9% |
[ 17.0% - 17.5% ] 17.26% | 134,580 | 16.5% |
[ 17.5% - 18.0% ] 17.72% | 61,760 | 7.0% |
[ 18.0% - 18.5% ] 18.20% | 217,815 | 26.5% |
[ 18.5% - 19.0% ] 18.66% | 97,301 | 22.9% |
[ 19.0% - 19.5% ] 19.43% | 242,816 | 12.4% |
[ 19.5% - 20.0% ] 19.74% | 19,112 | 35.4% |
[ 20.0% - 20.5% ] 20.42% | 36,389 | 21.0% |
[ 20.5% - 21.0% ] 20.73% | 34,807 | 14.5% |
[ 21.0% - 21.5% ] 21.30% | 28,219 | 34.5% |
[ 21.5% - 22.0% ] 21.64% | 52,440 | 32.9% |
[ 22.5% - 23.0% ] 22.71% | 51,026 | 22.8% |
[ 23.5% - 24.0% ] 23.99% | 14,553 | 40.3% |
[ 24.0% - 24.5% ] 24.44% | 24,795 | 37.3% |
[ 26.0% - 26.5% ] 26.04% | 1,056 | 19.3% |
[ 28.0% - 28.5% ] 28.05% | 29,533 | 46.1% |
[ 30.5% - 31.0% ] 30.74% | 15,489 | 11.3% |
[ 31.0% - 31.5% ] 31.35% | 2,485 | 3.3% |
[ 35.0% - 35.5% ] 35.23% | 1,286 | 26.7% |
[ 40.5% - 41.0% ] 40.56% | 9,613 | 64.9% |
[ 41.5% - 42.0% ] 41.76% | 613 | 48.6% |
[ 43.0% - 43.5% ] 43.29% | 633 | 45.3% |
[ 47.0% - 47.5% ] 47.10% | 1,157 | 70.0% |
[ 49.0% - 49.5% ] 49.01% | 8,892 | 47.2% |
[ 55.0% - 55.5% ] 55.41% | 231 | 100.0% |
[ 58.0% - 58.5% ] 58.19% | 574 | 100.0% |
[ 59.0% - 59.5% ] 59.02% | 549 | 62.5% |
[ 65.5% - 66.0% ] 65.55% | 479 | 100.0% |
[ 68.5% - 69.0% ] 68.60% | 86 | 100.0% |