Subsaharan African Disability Age Over 75
COMPARE
Subsaharan African
Select to Compare
Disability Age Over 75
Subsaharan African Disability Age Over 75
48.2%
DISABILITY | AGE OVER 75
3.8/ 100
METRIC RATING
234th/ 347
METRIC RANK
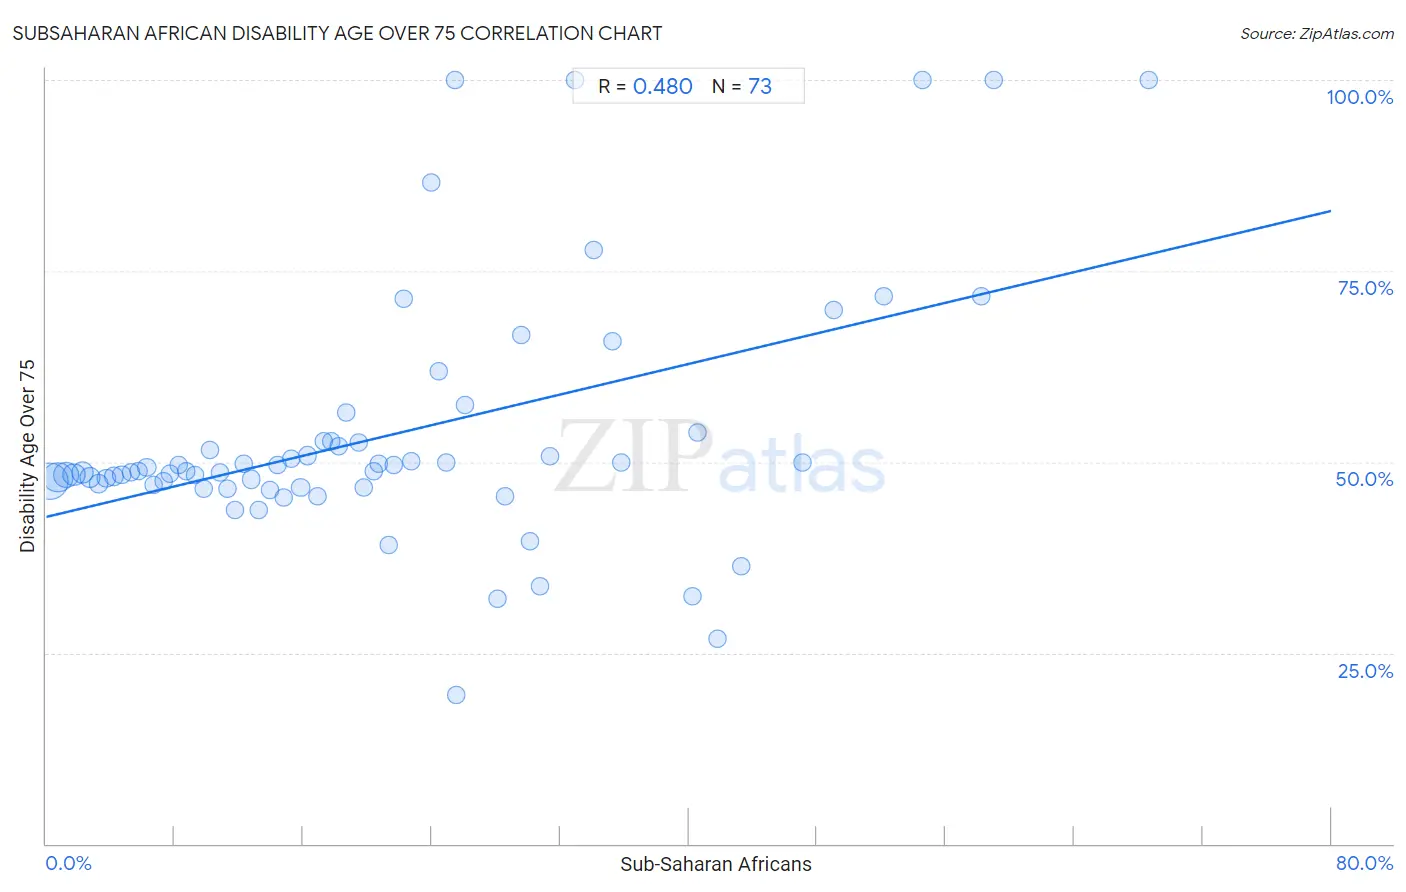
Subsaharan African Disability Age Over 75 Correlation Chart
The statistical analysis conducted on geographies consisting of 506,598,024 people shows a moderate positive correlation between the proportion of Sub-Saharan Africans and percentage of population with a disability over the age of 75 in the United States with a correlation coefficient (R) of 0.480 and weighted average of 48.2%. On average, for every 1% (one percent) increase in Sub-Saharan Africans within a typical geography, there is an increase of 0.50% in percentage of population with a disability over the age of 75.
It is essential to understand that the correlation between the percentage of Sub-Saharan Africans and percentage of population with a disability over the age of 75 does not imply a direct cause-and-effect relationship. It remains uncertain whether the presence of Sub-Saharan Africans influences an upward or downward trend in the level of percentage of population with a disability over the age of 75 within an area, or if Sub-Saharan Africans simply ended up residing in those areas with higher or lower levels of percentage of population with a disability over the age of 75 due to other factors.
Demographics Similar to Sub-Saharan Africans by Disability Age Over 75
In terms of disability age over 75, the demographic groups most similar to Sub-Saharan Africans are Hmong (48.2%, a difference of 0.0%), Indonesian (48.2%, a difference of 0.060%), Cree (48.2%, a difference of 0.060%), Immigrants (48.2%, a difference of 0.080%), and Taiwanese (48.2%, a difference of 0.090%).
| Demographics | Rating | Rank | Disability Age Over 75 |
| Zimbabweans | 6.4 /100 | #227 | Tragic 48.1% |
| Immigrants from Liberia | 5.9 /100 | #228 | Tragic 48.1% |
| Spaniards | 5.7 /100 | #229 | Tragic 48.1% |
| Taiwanese | 4.4 /100 | #230 | Tragic 48.2% |
| Immigrants | 4.3 /100 | #231 | Tragic 48.2% |
| Indonesians | 4.2 /100 | #232 | Tragic 48.2% |
| Cree | 4.2 /100 | #233 | Tragic 48.2% |
| Sub-Saharan Africans | 3.8 /100 | #234 | Tragic 48.2% |
| Hmong | 3.8 /100 | #235 | Tragic 48.2% |
| Immigrants from Nicaragua | 3.2 /100 | #236 | Tragic 48.2% |
| Immigrants from St. Vincent and the Grenadines | 3.2 /100 | #237 | Tragic 48.2% |
| Nicaraguans | 3.0 /100 | #238 | Tragic 48.3% |
| Immigrants from Thailand | 2.8 /100 | #239 | Tragic 48.3% |
| Tongans | 2.3 /100 | #240 | Tragic 48.3% |
| Native Hawaiians | 2.2 /100 | #241 | Tragic 48.3% |
Subsaharan African Disability Age Over 75 Correlation Summary
| Measurement | Subsaharan African Data | Disability Age Over 75 Data |
| Minimum | 0.24% | 19.4% |
| Maximum | 68.6% | 100.0% |
| Range | 68.4% | 80.6% |
| Mean | 21.2% | 53.4% |
| Median | 18.2% | 48.8% |
| Interquartile 25% (IQ1) | 9.0% | 46.9% |
| Interquartile 75% (IQ3) | 29.8% | 52.7% |
| Interquartile Range (IQR) | 20.8% | 5.8% |
| Standard Deviation (Sample) | 15.7% | 16.4% |
| Standard Deviation (Population) | 15.6% | 16.3% |
Correlation Details
| Subsaharan African Percentile | Sample Size | Disability Age Over 75 |
[ 0.0% - 0.5% ] 0.24% | 172,162,729 | 47.4% |
[ 0.5% - 1.0% ] 0.72% | 106,721,297 | 47.9% |
[ 1.0% - 1.5% ] 1.24% | 70,544,639 | 48.3% |
[ 1.5% - 2.0% ] 1.73% | 41,054,777 | 48.3% |
[ 2.0% - 2.5% ] 2.25% | 34,177,974 | 48.6% |
[ 2.5% - 3.0% ] 2.73% | 23,313,038 | 48.0% |
[ 3.0% - 3.5% ] 3.23% | 13,193,146 | 47.2% |
[ 3.5% - 4.0% ] 3.75% | 9,249,103 | 47.9% |
[ 4.0% - 4.5% ] 4.22% | 8,834,292 | 48.1% |
[ 4.5% - 5.0% ] 4.71% | 4,046,664 | 48.3% |
[ 5.0% - 5.5% ] 5.29% | 3,756,237 | 48.7% |
[ 5.5% - 6.0% ] 5.77% | 3,281,883 | 48.8% |
[ 6.0% - 6.5% ] 6.26% | 2,172,045 | 49.3% |
[ 6.5% - 7.0% ] 6.66% | 2,501,144 | 47.0% |
[ 7.0% - 7.5% ] 7.34% | 1,481,895 | 47.5% |
[ 7.5% - 8.0% ] 7.73% | 1,546,796 | 48.5% |
[ 8.0% - 8.5% ] 8.23% | 987,701 | 49.6% |
[ 8.5% - 9.0% ] 8.72% | 992,525 | 48.7% |
[ 9.0% - 9.5% ] 9.27% | 865,728 | 48.3% |
[ 9.5% - 10.0% ] 9.78% | 412,214 | 46.4% |
[ 10.0% - 10.5% ] 10.22% | 751,888 | 51.6% |
[ 10.5% - 11.0% ] 10.78% | 527,820 | 48.6% |
[ 11.0% - 11.5% ] 11.27% | 652,939 | 46.4% |
[ 11.5% - 12.0% ] 11.75% | 279,205 | 43.7% |
[ 12.0% - 12.5% ] 12.27% | 100,580 | 49.7% |
[ 12.5% - 13.0% ] 12.77% | 182,179 | 47.7% |
[ 13.0% - 13.5% ] 13.23% | 438,825 | 43.7% |
[ 13.5% - 14.0% ] 13.91% | 351,386 | 46.2% |
[ 14.0% - 14.5% ] 14.38% | 83,148 | 49.5% |
[ 14.5% - 15.0% ] 14.81% | 134,284 | 45.4% |
[ 15.0% - 15.5% ] 15.22% | 236,255 | 50.4% |
[ 15.5% - 16.0% ] 15.84% | 217,851 | 46.7% |
[ 16.0% - 16.5% ] 16.25% | 194,429 | 50.8% |
[ 16.5% - 17.0% ] 16.91% | 29,350 | 45.4% |
[ 17.0% - 17.5% ] 17.26% | 145,391 | 52.6% |
[ 17.5% - 18.0% ] 17.73% | 65,973 | 52.7% |
[ 18.0% - 18.5% ] 18.20% | 220,571 | 52.0% |
[ 18.5% - 19.0% ] 18.66% | 97,301 | 56.5% |
[ 19.0% - 19.5% ] 19.43% | 243,201 | 52.6% |
[ 19.5% - 20.0% ] 19.74% | 19,840 | 46.7% |
[ 20.0% - 20.5% ] 20.40% | 38,685 | 48.8% |
[ 20.5% - 21.0% ] 20.73% | 34,686 | 49.7% |
[ 21.0% - 21.5% ] 21.32% | 25,224 | 39.2% |
[ 21.5% - 22.0% ] 21.65% | 54,524 | 49.6% |
[ 22.0% - 22.5% ] 22.26% | 283 | 71.4% |
[ 22.5% - 23.0% ] 22.71% | 51,871 | 50.1% |
[ 23.5% - 24.0% ] 23.99% | 14,696 | 86.6% |
[ 24.0% - 24.5% ] 24.44% | 24,894 | 61.9% |
[ 24.5% - 25.0% ] 24.91% | 273 | 50.0% |
[ 25.0% - 25.5% ] 25.47% | 267 | 100.0% |
[ 25.5% - 26.0% ] 25.54% | 881 | 19.4% |
[ 26.0% - 26.5% ] 26.04% | 1,056 | 57.5% |
[ 28.0% - 28.5% ] 28.06% | 29,898 | 32.1% |
[ 28.5% - 29.0% ] 28.57% | 154 | 45.5% |
[ 29.5% - 30.0% ] 29.55% | 44 | 66.7% |
[ 30.0% - 30.5% ] 30.12% | 1,932 | 39.6% |
[ 30.5% - 31.0% ] 30.74% | 15,489 | 33.7% |
[ 31.0% - 31.5% ] 31.35% | 2,485 | 50.7% |
[ 32.5% - 33.0% ] 32.93% | 334 | 100.0% |
[ 34.0% - 34.5% ] 34.07% | 3,824 | 77.8% |
[ 35.0% - 35.5% ] 35.23% | 1,286 | 65.7% |
[ 35.5% - 36.0% ] 35.82% | 67 | 50.0% |
[ 40.0% - 40.5% ] 40.22% | 4,572 | 32.4% |
[ 40.5% - 41.0% ] 40.56% | 9,613 | 53.8% |
[ 41.5% - 42.0% ] 41.76% | 613 | 26.8% |
[ 43.0% - 43.5% ] 43.29% | 633 | 36.4% |
[ 47.0% - 47.5% ] 47.10% | 1,157 | 50.0% |
[ 49.0% - 49.5% ] 49.02% | 9,074 | 69.9% |
[ 52.0% - 52.5% ] 52.17% | 46 | 71.7% |
[ 54.5% - 55.0% ] 54.55% | 11 | 100.0% |
[ 58.0% - 58.5% ] 58.19% | 574 | 71.7% |
[ 59.0% - 59.5% ] 59.02% | 549 | 100.0% |
[ 68.5% - 69.0% ] 68.60% | 86 | 100.0% |