South American Indian vs Immigrants from Moldova Married-couple Households
COMPARE
South American Indian
Immigrants from Moldova
Married-couple Households
Married-couple Households Comparison
South American Indians
Immigrants from Moldova
46.0%
MARRIED-COUPLE HOUSEHOLDS
28.4/ 100
METRIC RATING
188th/ 347
METRIC RANK
48.0%
MARRIED-COUPLE HOUSEHOLDS
97.0/ 100
METRIC RATING
91st/ 347
METRIC RANK
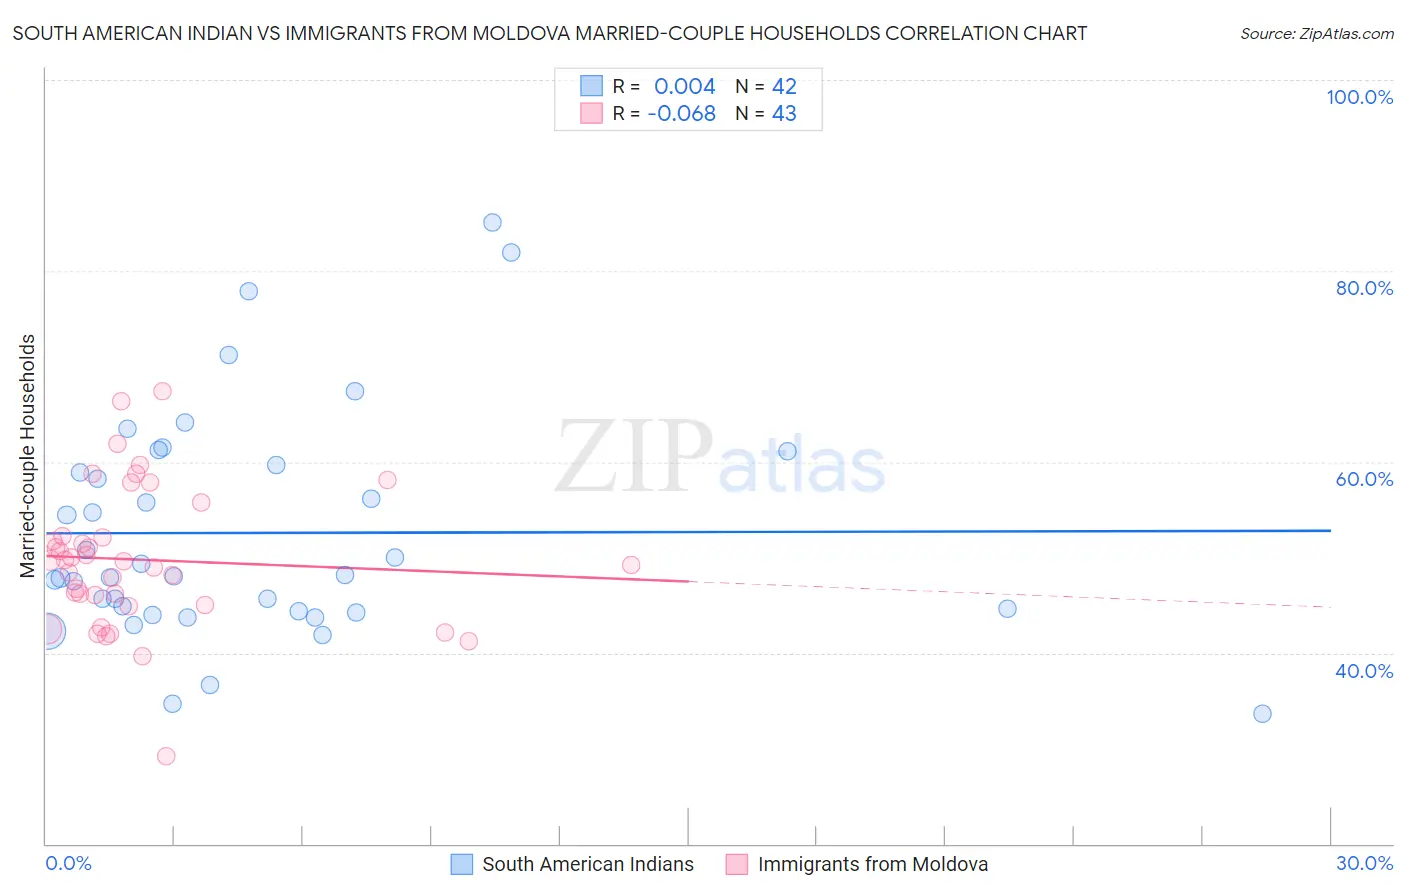
South American Indian vs Immigrants from Moldova Married-couple Households Correlation Chart
The statistical analysis conducted on geographies consisting of 164,540,449 people shows no correlation between the proportion of South American Indians and percentage of married-couple family households in the United States with a correlation coefficient (R) of 0.004 and weighted average of 46.0%. Similarly, the statistical analysis conducted on geographies consisting of 124,364,803 people shows a slight negative correlation between the proportion of Immigrants from Moldova and percentage of married-couple family households in the United States with a correlation coefficient (R) of -0.068 and weighted average of 48.0%, a difference of 4.2%.
Married-couple Households Correlation Summary
| Measurement | South American Indian | Immigrants from Moldova |
| Minimum | 33.6% | 29.2% |
| Maximum | 85.1% | 67.4% |
| Range | 51.5% | 38.3% |
| Mean | 52.6% | 49.7% |
| Median | 48.0% | 49.6% |
| Interquartile 25% (IQ1) | 44.3% | 45.0% |
| Interquartile 75% (IQ3) | 59.6% | 52.2% |
| Interquartile Range (IQR) | 15.3% | 7.2% |
| Standard Deviation (Sample) | 11.9% | 7.4% |
| Standard Deviation (Population) | 11.7% | 7.3% |
Similar Demographics by Married-couple Households
Demographics Similar to South American Indians by Married-couple Households
In terms of married-couple households, the demographic groups most similar to South American Indians are Fijian (46.1%, a difference of 0.040%), Immigrants from Latvia (46.0%, a difference of 0.070%), Albanian (46.1%, a difference of 0.13%), Immigrants from Kuwait (46.0%, a difference of 0.14%), and Choctaw (46.0%, a difference of 0.17%).
| Demographics | Rating | Rank | Married-couple Households |
| Malaysians | 41.8 /100 | #181 | Average 46.3% |
| Yugoslavians | 38.9 /100 | #182 | Fair 46.2% |
| Immigrants | Brazil | 38.3 /100 | #183 | Fair 46.2% |
| Immigrants | Switzerland | 36.9 /100 | #184 | Fair 46.2% |
| Brazilians | 35.9 /100 | #185 | Fair 46.2% |
| Albanians | 31.1 /100 | #186 | Fair 46.1% |
| Fijians | 29.2 /100 | #187 | Fair 46.1% |
| South American Indians | 28.4 /100 | #188 | Fair 46.0% |
| Immigrants | Latvia | 26.9 /100 | #189 | Fair 46.0% |
| Immigrants | Kuwait | 25.6 /100 | #190 | Fair 46.0% |
| Choctaw | 24.9 /100 | #191 | Fair 46.0% |
| Immigrants | Northern Africa | 24.6 /100 | #192 | Fair 46.0% |
| Taiwanese | 23.4 /100 | #193 | Fair 45.9% |
| Mexican American Indians | 23.3 /100 | #194 | Fair 45.9% |
| Chickasaw | 22.7 /100 | #195 | Fair 45.9% |
Demographics Similar to Immigrants from Moldova by Married-couple Households
In terms of married-couple households, the demographic groups most similar to Immigrants from Moldova are Palestinian (48.0%, a difference of 0.020%), Lebanese (47.9%, a difference of 0.040%), American (47.9%, a difference of 0.040%), French (48.0%, a difference of 0.060%), and Immigrants from Belgium (47.9%, a difference of 0.070%).
| Demographics | Rating | Rank | Married-couple Households |
| Ukrainians | 97.6 /100 | #84 | Exceptional 48.1% |
| Immigrants | Israel | 97.4 /100 | #85 | Exceptional 48.0% |
| Belgians | 97.4 /100 | #86 | Exceptional 48.0% |
| Immigrants | Ireland | 97.3 /100 | #87 | Exceptional 48.0% |
| Afghans | 97.3 /100 | #88 | Exceptional 48.0% |
| Cypriots | 97.2 /100 | #89 | Exceptional 48.0% |
| French | 97.2 /100 | #90 | Exceptional 48.0% |
| Immigrants | Moldova | 97.0 /100 | #91 | Exceptional 48.0% |
| Palestinians | 96.9 /100 | #92 | Exceptional 48.0% |
| Lebanese | 96.9 /100 | #93 | Exceptional 47.9% |
| Americans | 96.9 /100 | #94 | Exceptional 47.9% |
| Immigrants | Belgium | 96.8 /100 | #95 | Exceptional 47.9% |
| Immigrants | Egypt | 96.6 /100 | #96 | Exceptional 47.9% |
| Latvians | 96.5 /100 | #97 | Exceptional 47.9% |
| Immigrants | North Macedonia | 96.4 /100 | #98 | Exceptional 47.9% |