South American Indian vs New Zealander Married-couple Households
COMPARE
South American Indian
New Zealander
Married-couple Households
Married-couple Households Comparison
South American Indians
New Zealanders
46.0%
MARRIED-COUPLE HOUSEHOLDS
28.4/ 100
METRIC RATING
188th/ 347
METRIC RANK
47.2%
MARRIED-COUPLE HOUSEHOLDS
85.3/ 100
METRIC RATING
136th/ 347
METRIC RANK
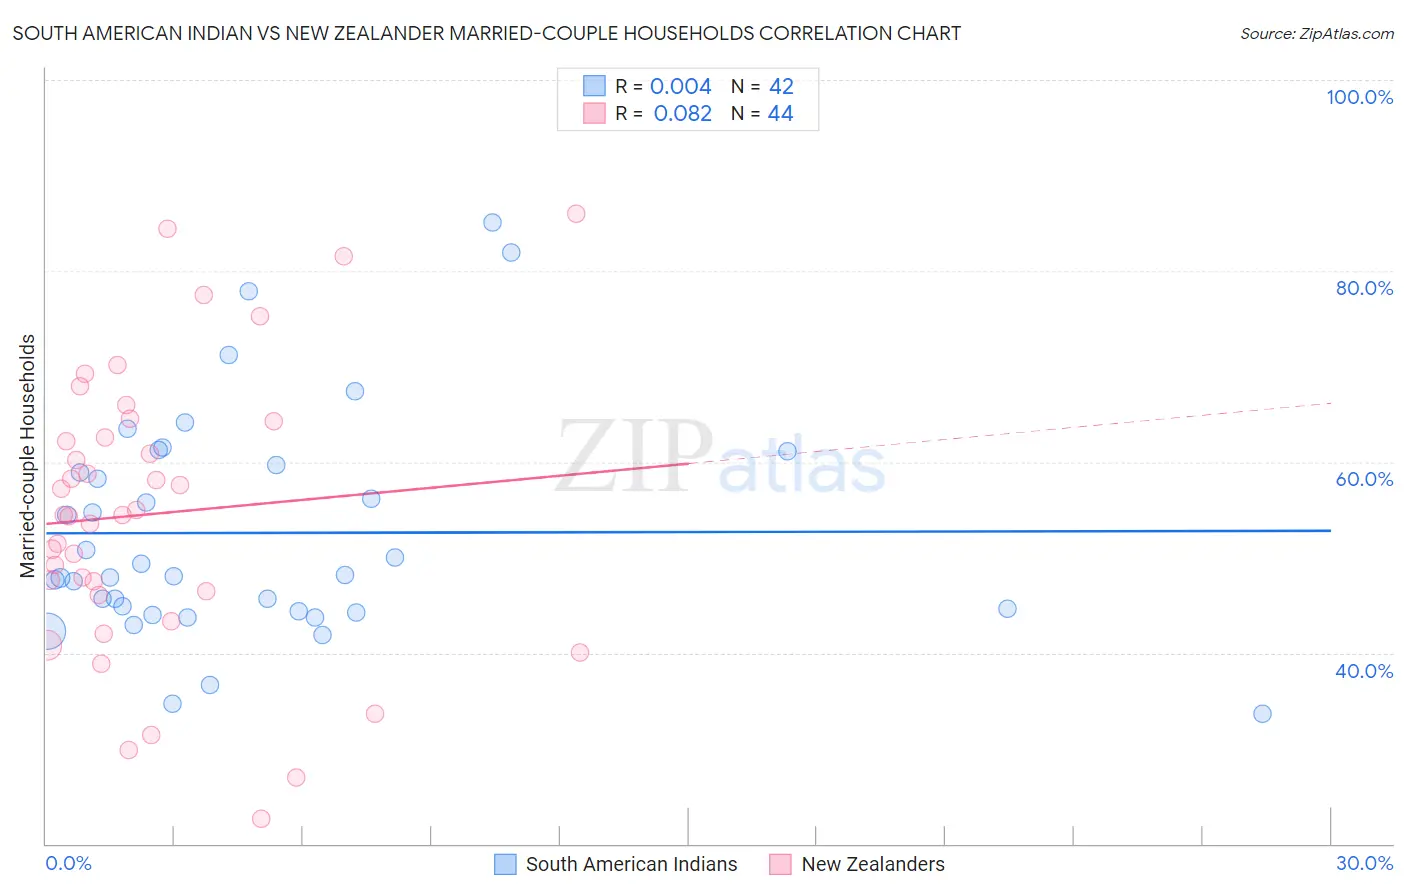
South American Indian vs New Zealander Married-couple Households Correlation Chart
The statistical analysis conducted on geographies consisting of 164,540,449 people shows no correlation between the proportion of South American Indians and percentage of married-couple family households in the United States with a correlation coefficient (R) of 0.004 and weighted average of 46.0%. Similarly, the statistical analysis conducted on geographies consisting of 106,894,441 people shows a slight positive correlation between the proportion of New Zealanders and percentage of married-couple family households in the United States with a correlation coefficient (R) of 0.082 and weighted average of 47.2%, a difference of 2.5%.
Married-couple Households Correlation Summary
| Measurement | South American Indian | New Zealander |
| Minimum | 33.6% | 22.7% |
| Maximum | 85.1% | 86.0% |
| Range | 51.5% | 63.3% |
| Mean | 52.6% | 54.6% |
| Median | 48.0% | 54.4% |
| Interquartile 25% (IQ1) | 44.3% | 46.3% |
| Interquartile 75% (IQ3) | 59.6% | 63.4% |
| Interquartile Range (IQR) | 15.3% | 17.2% |
| Standard Deviation (Sample) | 11.9% | 14.8% |
| Standard Deviation (Population) | 11.7% | 14.6% |
Similar Demographics by Married-couple Households
Demographics Similar to South American Indians by Married-couple Households
In terms of married-couple households, the demographic groups most similar to South American Indians are Fijian (46.1%, a difference of 0.040%), Immigrants from Latvia (46.0%, a difference of 0.070%), Albanian (46.1%, a difference of 0.13%), Immigrants from Kuwait (46.0%, a difference of 0.14%), and Choctaw (46.0%, a difference of 0.17%).
| Demographics | Rating | Rank | Married-couple Households |
| Malaysians | 41.8 /100 | #181 | Average 46.3% |
| Yugoslavians | 38.9 /100 | #182 | Fair 46.2% |
| Immigrants | Brazil | 38.3 /100 | #183 | Fair 46.2% |
| Immigrants | Switzerland | 36.9 /100 | #184 | Fair 46.2% |
| Brazilians | 35.9 /100 | #185 | Fair 46.2% |
| Albanians | 31.1 /100 | #186 | Fair 46.1% |
| Fijians | 29.2 /100 | #187 | Fair 46.1% |
| South American Indians | 28.4 /100 | #188 | Fair 46.0% |
| Immigrants | Latvia | 26.9 /100 | #189 | Fair 46.0% |
| Immigrants | Kuwait | 25.6 /100 | #190 | Fair 46.0% |
| Choctaw | 24.9 /100 | #191 | Fair 46.0% |
| Immigrants | Northern Africa | 24.6 /100 | #192 | Fair 46.0% |
| Taiwanese | 23.4 /100 | #193 | Fair 45.9% |
| Mexican American Indians | 23.3 /100 | #194 | Fair 45.9% |
| Chickasaw | 22.7 /100 | #195 | Fair 45.9% |
Demographics Similar to New Zealanders by Married-couple Households
In terms of married-couple households, the demographic groups most similar to New Zealanders are Immigrants from Malaysia (47.2%, a difference of 0.0%), Immigrants from Afghanistan (47.2%, a difference of 0.010%), Immigrants from Sweden (47.2%, a difference of 0.040%), Immigrants from Greece (47.2%, a difference of 0.050%), and Immigrants from Argentina (47.2%, a difference of 0.050%).
| Demographics | Rating | Rank | Married-couple Households |
| Immigrants | Iraq | 87.8 /100 | #129 | Excellent 47.3% |
| Immigrants | Hungary | 87.8 /100 | #130 | Excellent 47.3% |
| Immigrants | Denmark | 87.5 /100 | #131 | Excellent 47.3% |
| Immigrants | Ukraine | 86.7 /100 | #132 | Excellent 47.3% |
| South Africans | 86.4 /100 | #133 | Excellent 47.3% |
| Immigrants | Greece | 86.0 /100 | #134 | Excellent 47.2% |
| Immigrants | Argentina | 86.0 /100 | #135 | Excellent 47.2% |
| New Zealanders | 85.3 /100 | #136 | Excellent 47.2% |
| Immigrants | Malaysia | 85.2 /100 | #137 | Excellent 47.2% |
| Immigrants | Afghanistan | 85.1 /100 | #138 | Excellent 47.2% |
| Immigrants | Sweden | 84.7 /100 | #139 | Excellent 47.2% |
| Spanish | 84.5 /100 | #140 | Excellent 47.2% |
| Costa Ricans | 84.4 /100 | #141 | Excellent 47.2% |
| Spaniards | 84.1 /100 | #142 | Excellent 47.2% |
| Immigrants | Belarus | 83.8 /100 | #143 | Excellent 47.2% |