Panamanian vs Immigrants from Canada Married-couple Households
COMPARE
Panamanian
Immigrants from Canada
Married-couple Households
Married-couple Households Comparison
Panamanians
Immigrants from Canada
45.2%
MARRIED-COUPLE HOUSEHOLDS
5.5/ 100
METRIC RATING
217th/ 347
METRIC RANK
48.4%
MARRIED-COUPLE HOUSEHOLDS
99.0/ 100
METRIC RATING
65th/ 347
METRIC RANK
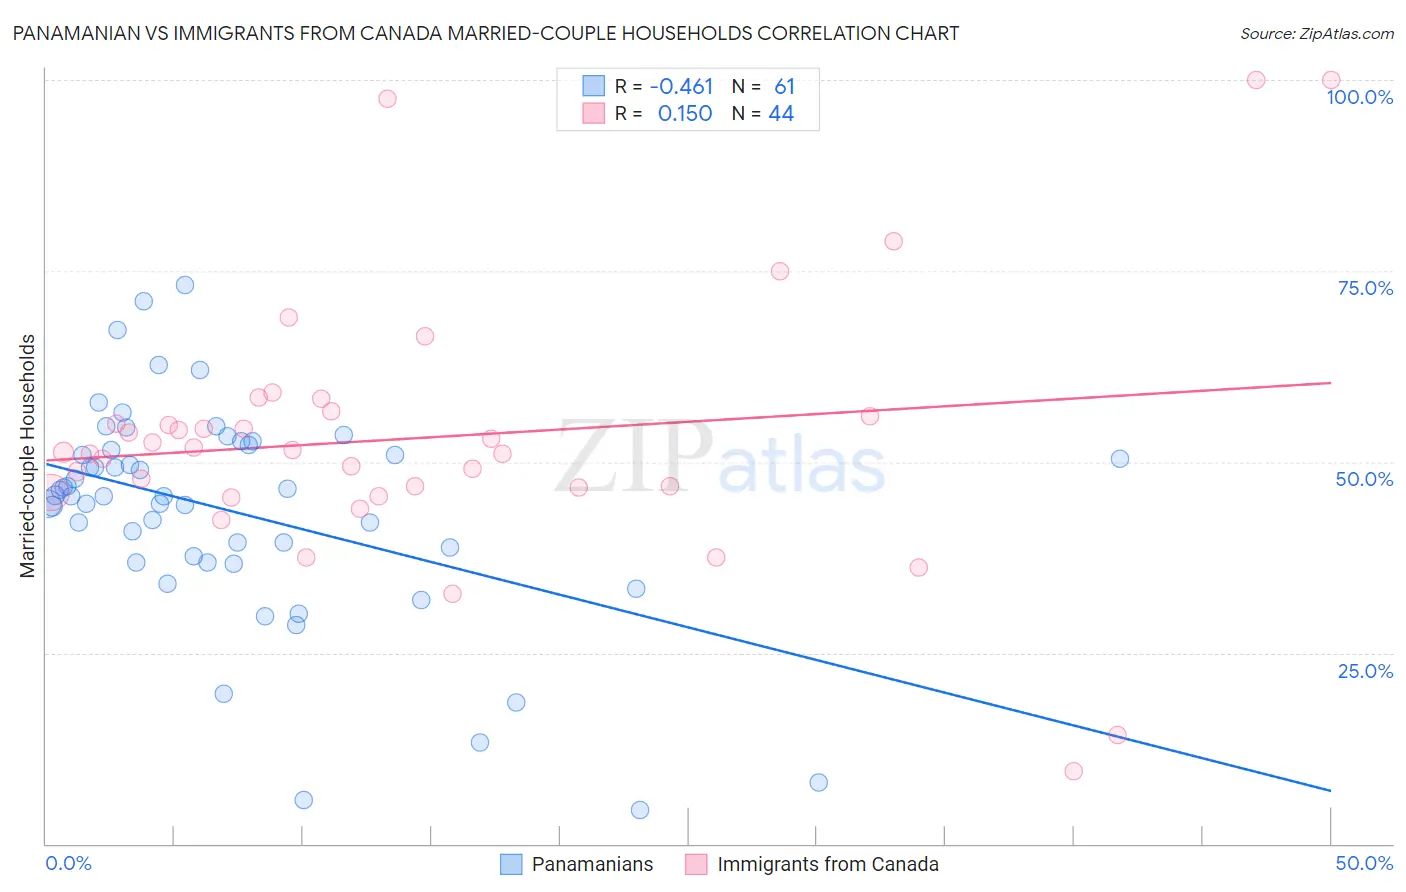
Panamanian vs Immigrants from Canada Married-couple Households Correlation Chart
The statistical analysis conducted on geographies consisting of 281,067,413 people shows a moderate negative correlation between the proportion of Panamanians and percentage of married-couple family households in the United States with a correlation coefficient (R) of -0.461 and weighted average of 45.2%. Similarly, the statistical analysis conducted on geographies consisting of 459,109,921 people shows a poor positive correlation between the proportion of Immigrants from Canada and percentage of married-couple family households in the United States with a correlation coefficient (R) of 0.150 and weighted average of 48.4%, a difference of 7.2%.
Married-couple Households Correlation Summary
| Measurement | Panamanian | Immigrants from Canada |
| Minimum | 4.4% | 9.5% |
| Maximum | 73.1% | 100.0% |
| Range | 68.8% | 90.5% |
| Mean | 43.6% | 53.2% |
| Median | 45.6% | 51.4% |
| Interquartile 25% (IQ1) | 37.2% | 46.4% |
| Interquartile 75% (IQ3) | 51.9% | 56.3% |
| Interquartile Range (IQR) | 14.7% | 9.9% |
| Standard Deviation (Sample) | 14.2% | 17.6% |
| Standard Deviation (Population) | 14.0% | 17.4% |
Similar Demographics by Married-couple Households
Demographics Similar to Panamanians by Married-couple Households
In terms of married-couple households, the demographic groups most similar to Panamanians are Immigrants from Nepal (45.2%, a difference of 0.020%), Immigrants from Portugal (45.2%, a difference of 0.020%), Immigrants from the Azores (45.2%, a difference of 0.030%), Nicaraguan (45.2%, a difference of 0.030%), and Japanese (45.2%, a difference of 0.040%).
| Demographics | Rating | Rank | Married-couple Households |
| Cubans | 7.7 /100 | #210 | Tragic 45.4% |
| Immigrants | Spain | 7.3 /100 | #211 | Tragic 45.3% |
| Creek | 6.4 /100 | #212 | Tragic 45.3% |
| Yakama | 5.8 /100 | #213 | Tragic 45.2% |
| Japanese | 5.7 /100 | #214 | Tragic 45.2% |
| Immigrants | Nepal | 5.6 /100 | #215 | Tragic 45.2% |
| Immigrants | Portugal | 5.6 /100 | #216 | Tragic 45.2% |
| Panamanians | 5.5 /100 | #217 | Tragic 45.2% |
| Immigrants | Azores | 5.3 /100 | #218 | Tragic 45.2% |
| Nicaraguans | 5.3 /100 | #219 | Tragic 45.2% |
| Immigrants | Thailand | 5.1 /100 | #220 | Tragic 45.2% |
| Tlingit-Haida | 4.9 /100 | #221 | Tragic 45.1% |
| Immigrants | Laos | 4.6 /100 | #222 | Tragic 45.1% |
| Immigrants | Cambodia | 2.7 /100 | #223 | Tragic 44.9% |
| Immigrants | Micronesia | 2.6 /100 | #224 | Tragic 44.9% |
Demographics Similar to Immigrants from Canada by Married-couple Households
In terms of married-couple households, the demographic groups most similar to Immigrants from Canada are Northern European (48.4%, a difference of 0.020%), Basque (48.4%, a difference of 0.030%), Jordanian (48.4%, a difference of 0.030%), Romanian (48.4%, a difference of 0.030%), and Immigrants from South Eastern Asia (48.4%, a difference of 0.040%).
| Demographics | Rating | Rank | Married-couple Households |
| Immigrants | Indonesia | 99.2 /100 | #58 | Exceptional 48.5% |
| Czechoslovakians | 99.2 /100 | #59 | Exceptional 48.5% |
| Croatians | 99.1 /100 | #60 | Exceptional 48.5% |
| Bulgarians | 99.1 /100 | #61 | Exceptional 48.5% |
| Luxembourgers | 99.1 /100 | #62 | Exceptional 48.5% |
| Basques | 99.0 /100 | #63 | Exceptional 48.4% |
| Northern Europeans | 99.0 /100 | #64 | Exceptional 48.4% |
| Immigrants | Canada | 99.0 /100 | #65 | Exceptional 48.4% |
| Jordanians | 98.9 /100 | #66 | Exceptional 48.4% |
| Romanians | 98.9 /100 | #67 | Exceptional 48.4% |
| Immigrants | South Eastern Asia | 98.9 /100 | #68 | Exceptional 48.4% |
| Immigrants | China | 98.9 /100 | #69 | Exceptional 48.4% |
| Immigrants | North America | 98.9 /100 | #70 | Exceptional 48.4% |
| Laotians | 98.8 /100 | #71 | Exceptional 48.4% |
| Scotch-Irish | 98.6 /100 | #72 | Exceptional 48.3% |