Mexican American Indian vs Immigrants from Norway Married-couple Households
COMPARE
Mexican American Indian
Immigrants from Norway
Married-couple Households
Married-couple Households Comparison
Mexican American Indians
Immigrants from Norway
45.9%
MARRIED-COUPLE HOUSEHOLDS
23.3/ 100
METRIC RATING
194th/ 347
METRIC RANK
46.5%
MARRIED-COUPLE HOUSEHOLDS
52.0/ 100
METRIC RATING
173rd/ 347
METRIC RANK
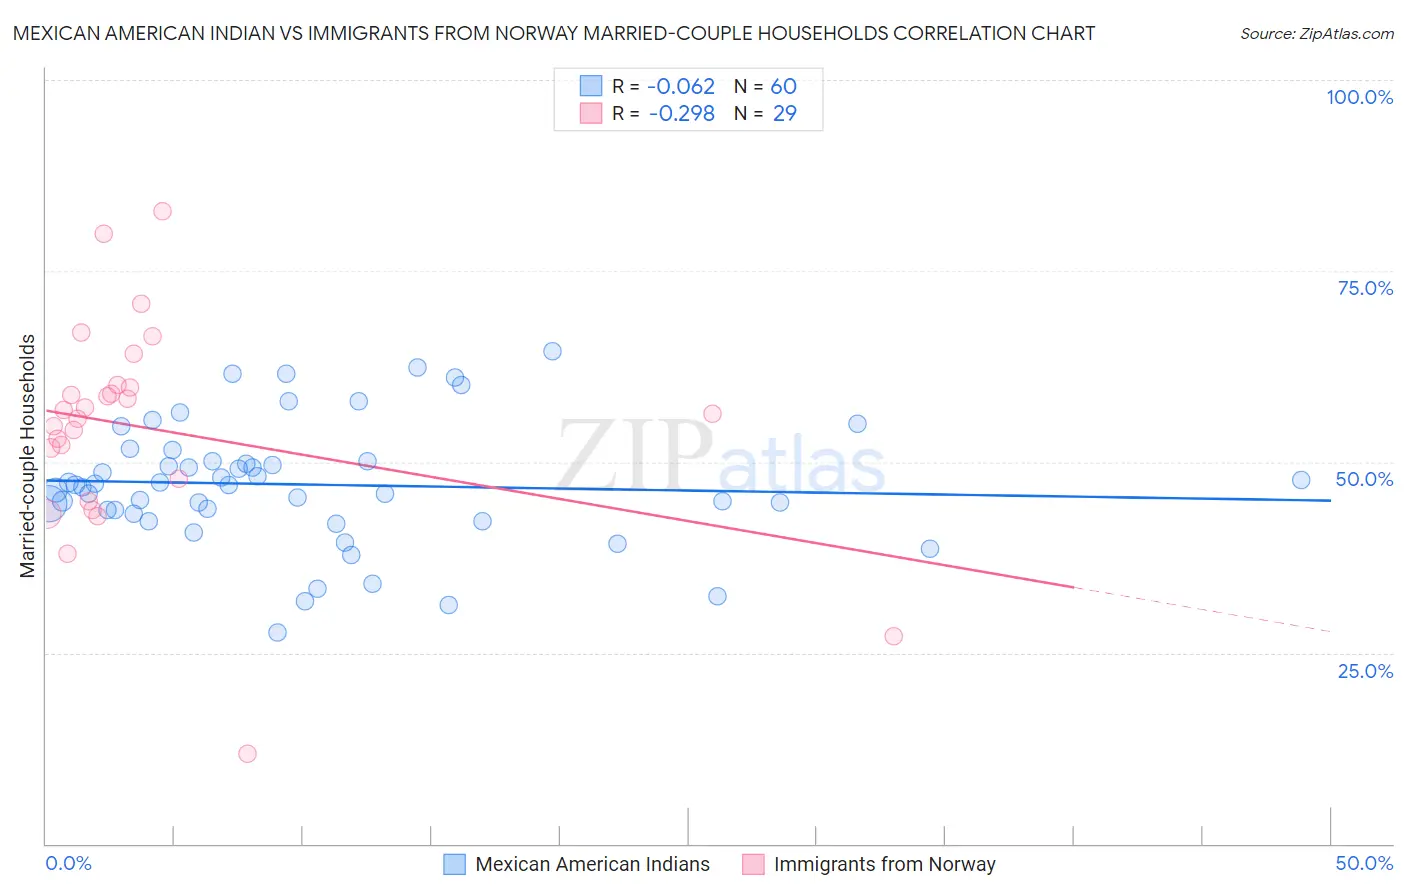
Mexican American Indian vs Immigrants from Norway Married-couple Households Correlation Chart
The statistical analysis conducted on geographies consisting of 317,492,406 people shows a slight negative correlation between the proportion of Mexican American Indians and percentage of married-couple family households in the United States with a correlation coefficient (R) of -0.062 and weighted average of 45.9%. Similarly, the statistical analysis conducted on geographies consisting of 116,686,104 people shows a weak negative correlation between the proportion of Immigrants from Norway and percentage of married-couple family households in the United States with a correlation coefficient (R) of -0.298 and weighted average of 46.5%, a difference of 1.2%.
Married-couple Households Correlation Summary
| Measurement | Mexican American Indian | Immigrants from Norway |
| Minimum | 27.7% | 11.8% |
| Maximum | 64.5% | 82.8% |
| Range | 36.8% | 71.0% |
| Mean | 47.0% | 54.3% |
| Median | 47.0% | 56.2% |
| Interquartile 25% (IQ1) | 43.4% | 46.3% |
| Interquartile 75% (IQ3) | 50.1% | 59.8% |
| Interquartile Range (IQR) | 6.7% | 13.6% |
| Standard Deviation (Sample) | 8.1% | 14.2% |
| Standard Deviation (Population) | 8.0% | 13.9% |
Similar Demographics by Married-couple Households
Demographics Similar to Mexican American Indians by Married-couple Households
In terms of married-couple households, the demographic groups most similar to Mexican American Indians are Taiwanese (45.9%, a difference of 0.010%), Chickasaw (45.9%, a difference of 0.030%), Immigrants from South America (45.9%, a difference of 0.060%), Immigrants from Northern Africa (46.0%, a difference of 0.070%), and Choctaw (46.0%, a difference of 0.080%).
| Demographics | Rating | Rank | Married-couple Households |
| Fijians | 29.2 /100 | #187 | Fair 46.1% |
| South American Indians | 28.4 /100 | #188 | Fair 46.0% |
| Immigrants | Latvia | 26.9 /100 | #189 | Fair 46.0% |
| Immigrants | Kuwait | 25.6 /100 | #190 | Fair 46.0% |
| Choctaw | 24.9 /100 | #191 | Fair 46.0% |
| Immigrants | Northern Africa | 24.6 /100 | #192 | Fair 46.0% |
| Taiwanese | 23.4 /100 | #193 | Fair 45.9% |
| Mexican American Indians | 23.3 /100 | #194 | Fair 45.9% |
| Chickasaw | 22.7 /100 | #195 | Fair 45.9% |
| Immigrants | South America | 22.2 /100 | #196 | Fair 45.9% |
| Cambodians | 21.3 /100 | #197 | Fair 45.9% |
| Ottawa | 19.4 /100 | #198 | Poor 45.8% |
| Carpatho Rusyns | 15.7 /100 | #199 | Poor 45.7% |
| Potawatomi | 15.6 /100 | #200 | Poor 45.7% |
| Immigrants | Serbia | 15.2 /100 | #201 | Poor 45.7% |
Demographics Similar to Immigrants from Norway by Married-couple Households
In terms of married-couple households, the demographic groups most similar to Immigrants from Norway are Immigrants from Mexico (46.4%, a difference of 0.070%), Immigrants from Australia (46.5%, a difference of 0.10%), Immigrants from Chile (46.5%, a difference of 0.14%), Immigrants from Colombia (46.4%, a difference of 0.22%), and South American (46.6%, a difference of 0.23%).
| Demographics | Rating | Rank | Married-couple Households |
| Cherokee | 65.7 /100 | #166 | Good 46.7% |
| Immigrants | Croatia | 64.2 /100 | #167 | Good 46.7% |
| Israelis | 62.3 /100 | #168 | Good 46.7% |
| Spanish American Indians | 59.4 /100 | #169 | Average 46.6% |
| South Americans | 58.0 /100 | #170 | Average 46.6% |
| Immigrants | Chile | 55.7 /100 | #171 | Average 46.5% |
| Immigrants | Australia | 54.6 /100 | #172 | Average 46.5% |
| Immigrants | Norway | 52.0 /100 | #173 | Average 46.5% |
| Immigrants | Mexico | 50.0 /100 | #174 | Average 46.4% |
| Immigrants | Colombia | 46.1 /100 | #175 | Average 46.4% |
| Cajuns | 45.2 /100 | #176 | Average 46.4% |
| Immigrants | Immigrants | 43.8 /100 | #177 | Average 46.3% |
| Immigrants | Costa Rica | 43.4 /100 | #178 | Average 46.3% |
| Immigrants | Zimbabwe | 43.0 /100 | #179 | Average 46.3% |
| Mongolians | 42.0 /100 | #180 | Average 46.3% |