Immigrants from Southern Europe vs Celtic Married-couple Households
COMPARE
Immigrants from Southern Europe
Celtic
Married-couple Households
Married-couple Households Comparison
Immigrants from Southern Europe
Celtics
46.8%
MARRIED-COUPLE HOUSEHOLDS
69.9/ 100
METRIC RATING
165th/ 347
METRIC RANK
47.3%
MARRIED-COUPLE HOUSEHOLDS
88.1/ 100
METRIC RATING
127th/ 347
METRIC RANK
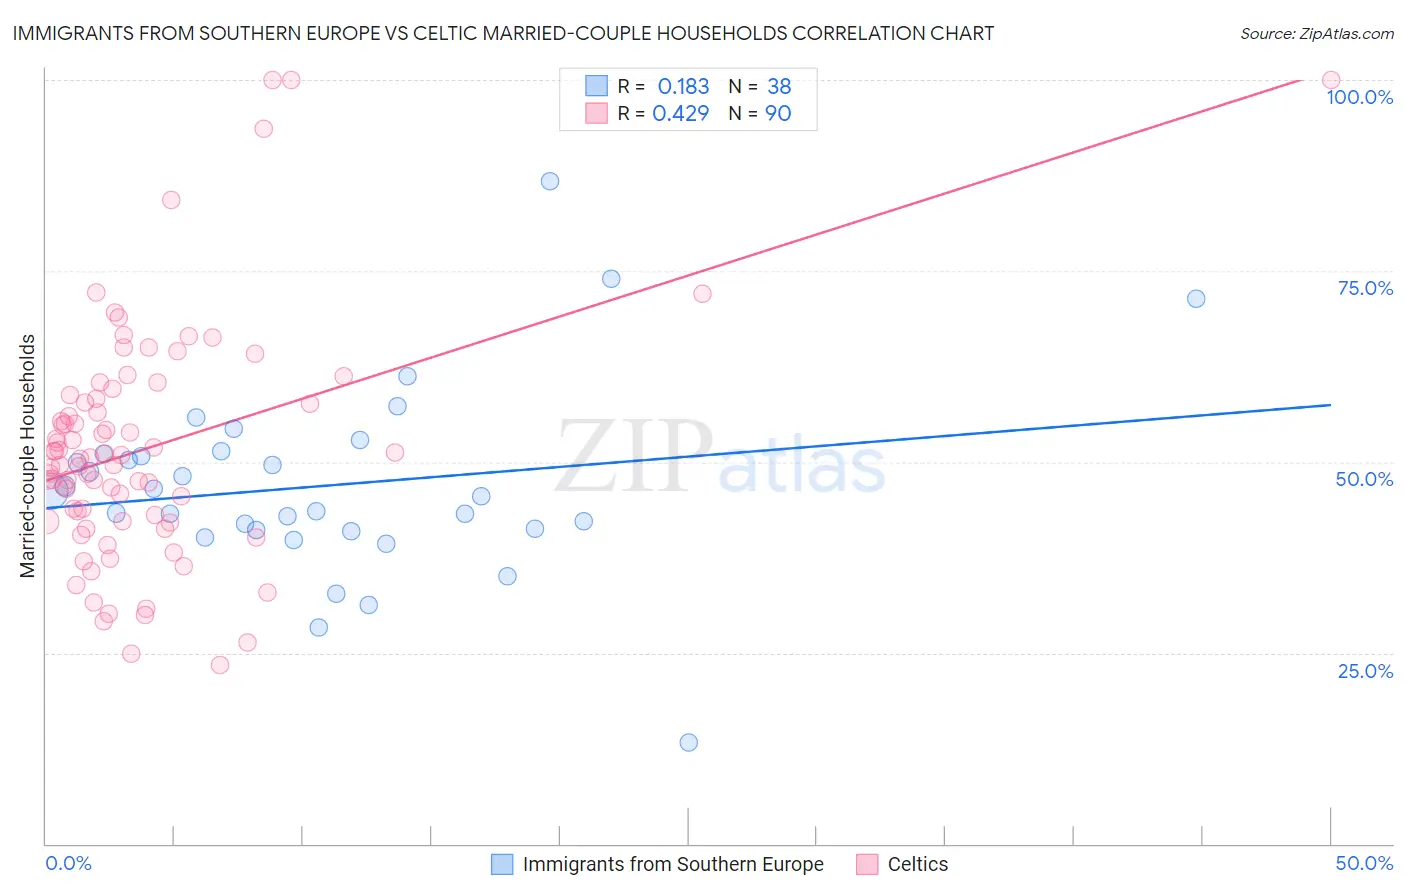
Immigrants from Southern Europe vs Celtic Married-couple Households Correlation Chart
The statistical analysis conducted on geographies consisting of 402,620,740 people shows a poor positive correlation between the proportion of Immigrants from Southern Europe and percentage of married-couple family households in the United States with a correlation coefficient (R) of 0.183 and weighted average of 46.8%. Similarly, the statistical analysis conducted on geographies consisting of 168,846,519 people shows a moderate positive correlation between the proportion of Celtics and percentage of married-couple family households in the United States with a correlation coefficient (R) of 0.429 and weighted average of 47.3%, a difference of 1.1%.
Married-couple Households Correlation Summary
| Measurement | Immigrants from Southern Europe | Celtic |
| Minimum | 13.2% | 23.4% |
| Maximum | 86.8% | 100.0% |
| Range | 73.6% | 76.6% |
| Mean | 46.9% | 51.8% |
| Median | 45.8% | 50.4% |
| Interquartile 25% (IQ1) | 41.1% | 42.3% |
| Interquartile 75% (IQ3) | 51.1% | 58.3% |
| Interquartile Range (IQR) | 10.0% | 16.1% |
| Standard Deviation (Sample) | 12.7% | 15.3% |
| Standard Deviation (Population) | 12.5% | 15.3% |
Similar Demographics by Married-couple Households
Demographics Similar to Immigrants from Southern Europe by Married-couple Households
In terms of married-couple households, the demographic groups most similar to Immigrants from Southern Europe are Immigrants from Kazakhstan (46.8%, a difference of 0.0%), Immigrants from Turkey (46.8%, a difference of 0.010%), Colombian (46.8%, a difference of 0.050%), Delaware (46.8%, a difference of 0.060%), and Iraqi (46.9%, a difference of 0.080%).
| Demographics | Rating | Rank | Married-couple Households |
| Immigrants | Nonimmigrants | 73.3 /100 | #158 | Good 46.9% |
| Osage | 73.2 /100 | #159 | Good 46.9% |
| Iraqis | 71.7 /100 | #160 | Good 46.9% |
| Delaware | 71.2 /100 | #161 | Good 46.8% |
| Colombians | 71.0 /100 | #162 | Good 46.8% |
| Immigrants | Turkey | 70.2 /100 | #163 | Good 46.8% |
| Immigrants | Kazakhstan | 70.0 /100 | #164 | Good 46.8% |
| Immigrants | Southern Europe | 69.9 /100 | #165 | Good 46.8% |
| Cherokee | 65.7 /100 | #166 | Good 46.7% |
| Immigrants | Croatia | 64.2 /100 | #167 | Good 46.7% |
| Israelis | 62.3 /100 | #168 | Good 46.7% |
| Spanish American Indians | 59.4 /100 | #169 | Average 46.6% |
| South Americans | 58.0 /100 | #170 | Average 46.6% |
| Immigrants | Chile | 55.7 /100 | #171 | Average 46.5% |
| Immigrants | Australia | 54.6 /100 | #172 | Average 46.5% |
Demographics Similar to Celtics by Married-couple Households
In terms of married-couple households, the demographic groups most similar to Celtics are Immigrants from Peru (47.3%, a difference of 0.020%), Immigrants from Iraq (47.3%, a difference of 0.030%), Immigrants from Hungary (47.3%, a difference of 0.030%), Pakistani (47.3%, a difference of 0.040%), and Immigrants from Denmark (47.3%, a difference of 0.050%).
| Demographics | Rating | Rank | Married-couple Households |
| Puget Sound Salish | 90.5 /100 | #120 | Exceptional 47.4% |
| Immigrants | Eastern Europe | 90.3 /100 | #121 | Exceptional 47.4% |
| Okinawans | 90.1 /100 | #122 | Exceptional 47.4% |
| Immigrants | Venezuela | 89.3 /100 | #123 | Excellent 47.4% |
| Zimbabweans | 89.2 /100 | #124 | Excellent 47.4% |
| Australians | 89.0 /100 | #125 | Excellent 47.4% |
| Pakistanis | 88.6 /100 | #126 | Excellent 47.3% |
| Celtics | 88.1 /100 | #127 | Excellent 47.3% |
| Immigrants | Peru | 87.9 /100 | #128 | Excellent 47.3% |
| Immigrants | Iraq | 87.8 /100 | #129 | Excellent 47.3% |
| Immigrants | Hungary | 87.8 /100 | #130 | Excellent 47.3% |
| Immigrants | Denmark | 87.5 /100 | #131 | Excellent 47.3% |
| Immigrants | Ukraine | 86.7 /100 | #132 | Excellent 47.3% |
| South Africans | 86.4 /100 | #133 | Excellent 47.3% |
| Immigrants | Greece | 86.0 /100 | #134 | Excellent 47.2% |