Immigrants from Southern Europe vs Czech Married-couple Households
COMPARE
Immigrants from Southern Europe
Czech
Married-couple Households
Married-couple Households Comparison
Immigrants from Southern Europe
Czechs
46.8%
MARRIED-COUPLE HOUSEHOLDS
69.9/ 100
METRIC RATING
165th/ 347
METRIC RANK
49.4%
MARRIED-COUPLE HOUSEHOLDS
99.9/ 100
METRIC RATING
24th/ 347
METRIC RANK
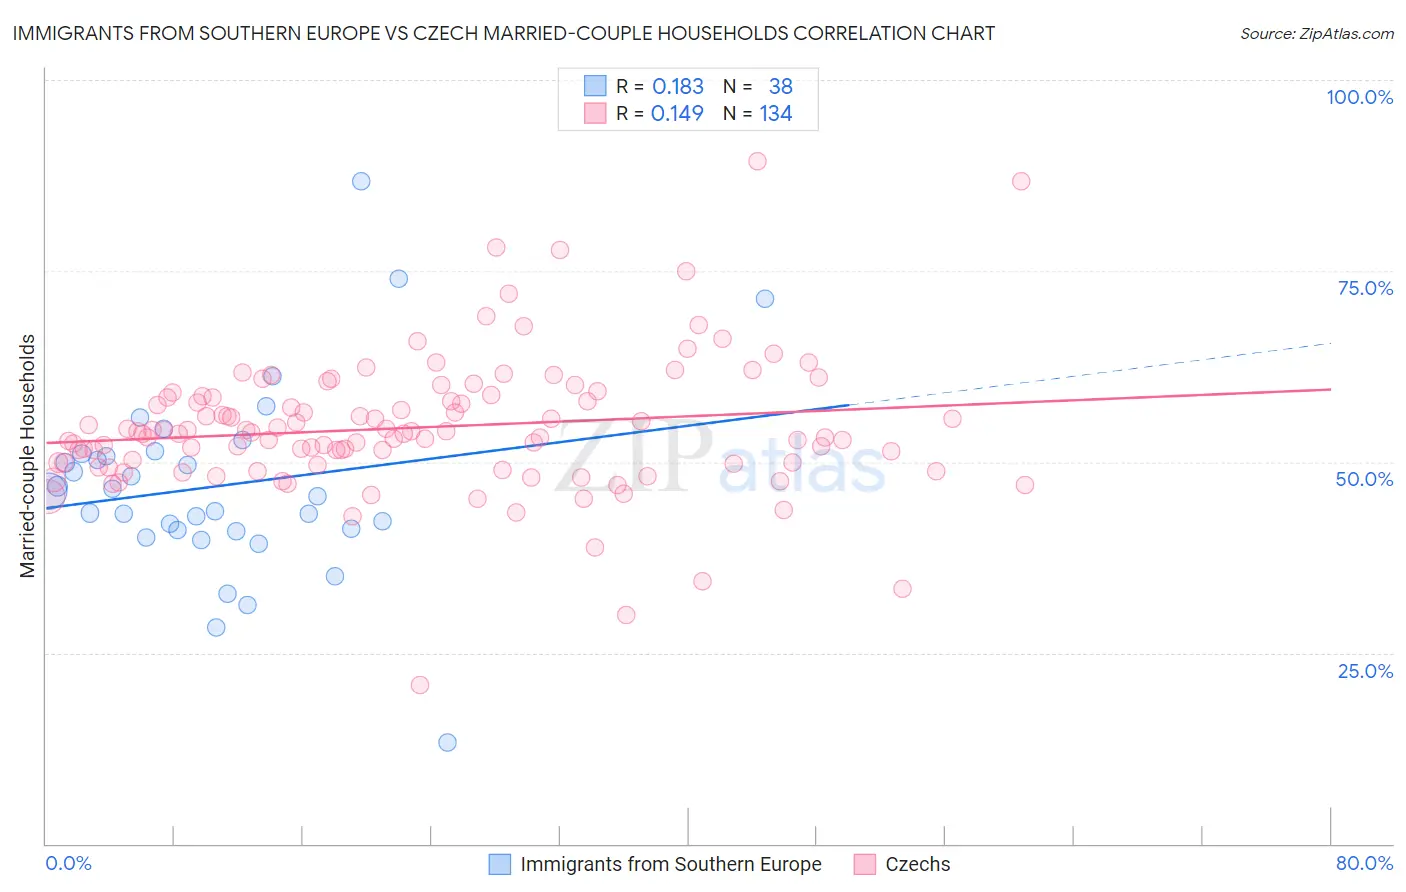
Immigrants from Southern Europe vs Czech Married-couple Households Correlation Chart
The statistical analysis conducted on geographies consisting of 402,620,740 people shows a poor positive correlation between the proportion of Immigrants from Southern Europe and percentage of married-couple family households in the United States with a correlation coefficient (R) of 0.183 and weighted average of 46.8%. Similarly, the statistical analysis conducted on geographies consisting of 484,447,060 people shows a poor positive correlation between the proportion of Czechs and percentage of married-couple family households in the United States with a correlation coefficient (R) of 0.149 and weighted average of 49.4%, a difference of 5.6%.
Married-couple Households Correlation Summary
| Measurement | Immigrants from Southern Europe | Czech |
| Minimum | 13.2% | 20.8% |
| Maximum | 86.8% | 89.3% |
| Range | 73.6% | 68.5% |
| Mean | 46.9% | 54.5% |
| Median | 45.8% | 53.7% |
| Interquartile 25% (IQ1) | 41.1% | 49.8% |
| Interquartile 75% (IQ3) | 51.1% | 58.5% |
| Interquartile Range (IQR) | 10.0% | 8.6% |
| Standard Deviation (Sample) | 12.7% | 9.0% |
| Standard Deviation (Population) | 12.5% | 9.0% |
Similar Demographics by Married-couple Households
Demographics Similar to Immigrants from Southern Europe by Married-couple Households
In terms of married-couple households, the demographic groups most similar to Immigrants from Southern Europe are Immigrants from Kazakhstan (46.8%, a difference of 0.0%), Immigrants from Turkey (46.8%, a difference of 0.010%), Colombian (46.8%, a difference of 0.050%), Delaware (46.8%, a difference of 0.060%), and Iraqi (46.9%, a difference of 0.080%).
| Demographics | Rating | Rank | Married-couple Households |
| Immigrants | Nonimmigrants | 73.3 /100 | #158 | Good 46.9% |
| Osage | 73.2 /100 | #159 | Good 46.9% |
| Iraqis | 71.7 /100 | #160 | Good 46.9% |
| Delaware | 71.2 /100 | #161 | Good 46.8% |
| Colombians | 71.0 /100 | #162 | Good 46.8% |
| Immigrants | Turkey | 70.2 /100 | #163 | Good 46.8% |
| Immigrants | Kazakhstan | 70.0 /100 | #164 | Good 46.8% |
| Immigrants | Southern Europe | 69.9 /100 | #165 | Good 46.8% |
| Cherokee | 65.7 /100 | #166 | Good 46.7% |
| Immigrants | Croatia | 64.2 /100 | #167 | Good 46.7% |
| Israelis | 62.3 /100 | #168 | Good 46.7% |
| Spanish American Indians | 59.4 /100 | #169 | Average 46.6% |
| South Americans | 58.0 /100 | #170 | Average 46.6% |
| Immigrants | Chile | 55.7 /100 | #171 | Average 46.5% |
| Immigrants | Australia | 54.6 /100 | #172 | Average 46.5% |
Demographics Similar to Czechs by Married-couple Households
In terms of married-couple households, the demographic groups most similar to Czechs are Dutch (49.5%, a difference of 0.080%), Asian (49.5%, a difference of 0.090%), Immigrants from Philippines (49.3%, a difference of 0.19%), Norwegian (49.5%, a difference of 0.20%), and European (49.6%, a difference of 0.26%).
| Demographics | Rating | Rank | Married-couple Households |
| Immigrants | Hong Kong | 99.9 /100 | #17 | Exceptional 49.6% |
| English | 99.9 /100 | #18 | Exceptional 49.6% |
| Europeans | 99.9 /100 | #19 | Exceptional 49.6% |
| Scandinavians | 99.9 /100 | #20 | Exceptional 49.6% |
| Norwegians | 99.9 /100 | #21 | Exceptional 49.5% |
| Asians | 99.9 /100 | #22 | Exceptional 49.5% |
| Dutch | 99.9 /100 | #23 | Exceptional 49.5% |
| Czechs | 99.9 /100 | #24 | Exceptional 49.4% |
| Immigrants | Philippines | 99.9 /100 | #25 | Exceptional 49.3% |
| Immigrants | Scotland | 99.8 /100 | #26 | Exceptional 49.3% |
| Bhutanese | 99.8 /100 | #27 | Exceptional 49.3% |
| Germans | 99.8 /100 | #28 | Exceptional 49.2% |
| Maltese | 99.8 /100 | #29 | Exceptional 49.2% |
| Bolivians | 99.8 /100 | #30 | Exceptional 49.2% |
| Native Hawaiians | 99.8 /100 | #31 | Exceptional 49.1% |