Taiwanese vs Senegalese GED/Equivalency
COMPARE
Taiwanese
Senegalese
GED/Equivalency
GED/Equivalency Comparison
Taiwanese
Senegalese
84.7%
GED/EQUIVALENCY
8.1/ 100
METRIC RATING
221st/ 347
METRIC RANK
84.0%
GED/EQUIVALENCY
1.9/ 100
METRIC RATING
241st/ 347
METRIC RANK
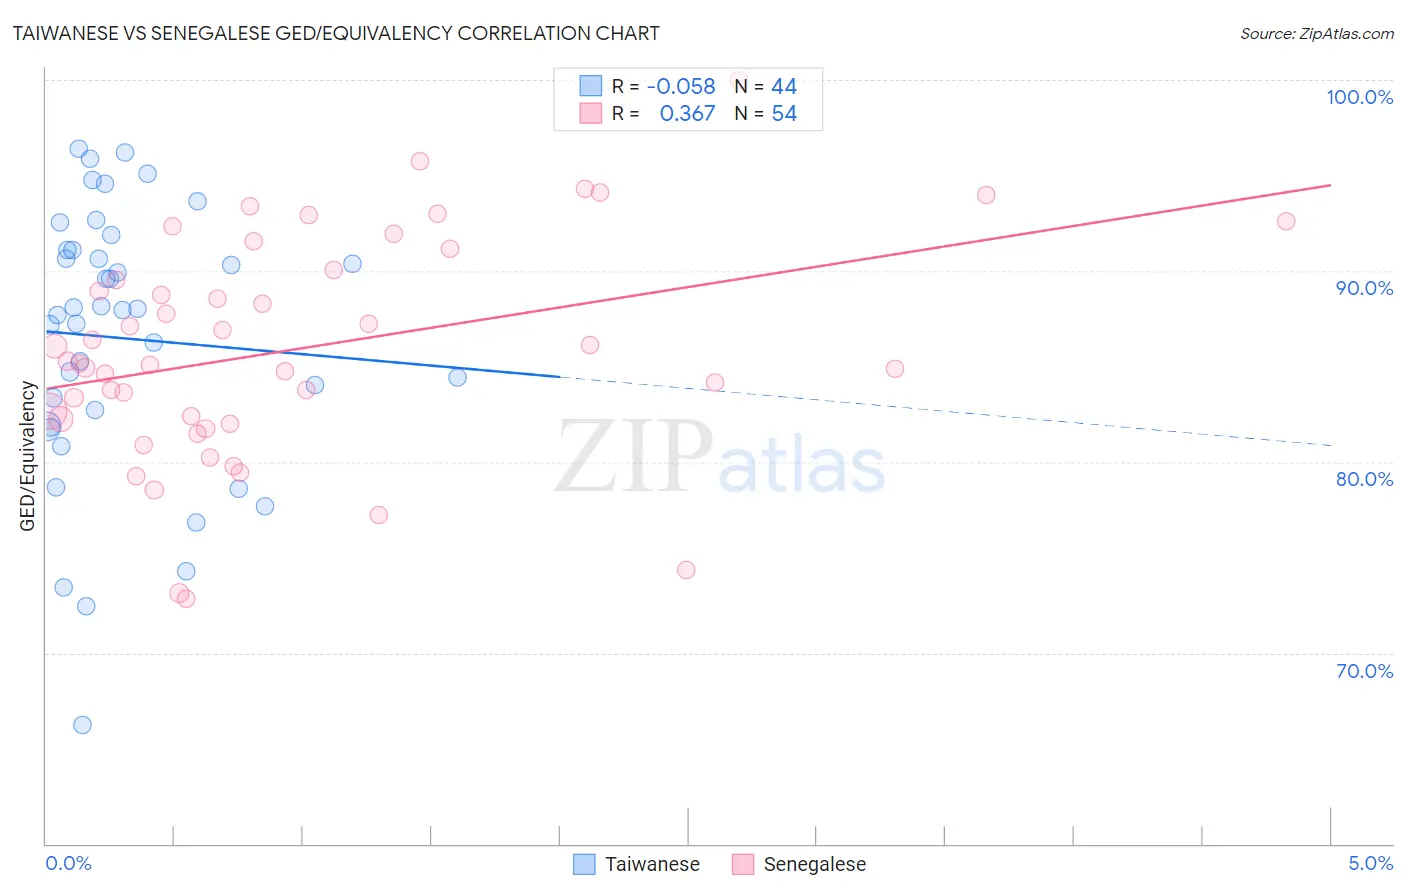
Taiwanese vs Senegalese GED/Equivalency Correlation Chart
The statistical analysis conducted on geographies consisting of 31,724,936 people shows a slight negative correlation between the proportion of Taiwanese and percentage of population with at least ged/equivalency education in the United States with a correlation coefficient (R) of -0.058 and weighted average of 84.7%. Similarly, the statistical analysis conducted on geographies consisting of 78,142,569 people shows a mild positive correlation between the proportion of Senegalese and percentage of population with at least ged/equivalency education in the United States with a correlation coefficient (R) of 0.367 and weighted average of 84.0%, a difference of 0.78%.
GED/Equivalency Correlation Summary
| Measurement | Taiwanese | Senegalese |
| Minimum | 66.2% | 72.9% |
| Maximum | 96.4% | 100.0% |
| Range | 30.1% | 27.1% |
| Mean | 86.5% | 85.9% |
| Median | 88.0% | 85.2% |
| Interquartile 25% (IQ1) | 82.3% | 82.3% |
| Interquartile 75% (IQ3) | 91.1% | 90.0% |
| Interquartile Range (IQR) | 8.8% | 7.8% |
| Standard Deviation (Sample) | 7.0% | 5.8% |
| Standard Deviation (Population) | 7.0% | 5.8% |
Demographics Similar to Taiwanese and Senegalese by GED/Equivalency
In terms of ged/equivalency, the demographic groups most similar to Taiwanese are Iroquois (84.6%, a difference of 0.040%), Immigrants from Uzbekistan (84.6%, a difference of 0.070%), French American Indian (84.6%, a difference of 0.13%), Immigrants from Thailand (84.5%, a difference of 0.19%), and Immigrants from Zaire (84.5%, a difference of 0.21%). Similarly, the demographic groups most similar to Senegalese are Immigrants from South Eastern Asia (84.1%, a difference of 0.14%), Immigrants from Bahamas (84.2%, a difference of 0.15%), Immigrants from Peru (84.2%, a difference of 0.18%), Subsaharan African (84.2%, a difference of 0.24%), and Ghanaian (84.3%, a difference of 0.31%).
| Demographics | Rating | Rank | GED/Equivalency |
| Taiwanese | 8.1 /100 | #221 | Tragic 84.7% |
| Iroquois | 7.5 /100 | #222 | Tragic 84.6% |
| Immigrants | Uzbekistan | 7.1 /100 | #223 | Tragic 84.6% |
| French American Indians | 6.3 /100 | #224 | Tragic 84.6% |
| Immigrants | Thailand | 5.8 /100 | #225 | Tragic 84.5% |
| Immigrants | Zaire | 5.5 /100 | #226 | Tragic 84.5% |
| Immigrants | Costa Rica | 5.4 /100 | #227 | Tragic 84.5% |
| Immigrants | Liberia | 4.9 /100 | #228 | Tragic 84.4% |
| Immigrants | Uruguay | 4.6 /100 | #229 | Tragic 84.4% |
| Immigrants | Colombia | 4.5 /100 | #230 | Tragic 84.4% |
| Immigrants | Middle Africa | 4.3 /100 | #231 | Tragic 84.4% |
| Immigrants | South America | 4.2 /100 | #232 | Tragic 84.4% |
| Immigrants | Panama | 4.1 /100 | #233 | Tragic 84.4% |
| Immigrants | Nigeria | 3.6 /100 | #234 | Tragic 84.3% |
| Ghanaians | 3.5 /100 | #235 | Tragic 84.3% |
| Immigrants | Eritrea | 3.5 /100 | #236 | Tragic 84.3% |
| Sub-Saharan Africans | 3.0 /100 | #237 | Tragic 84.2% |
| Immigrants | Peru | 2.7 /100 | #238 | Tragic 84.2% |
| Immigrants | Bahamas | 2.6 /100 | #239 | Tragic 84.2% |
| Immigrants | South Eastern Asia | 2.5 /100 | #240 | Tragic 84.1% |
| Senegalese | 1.9 /100 | #241 | Tragic 84.0% |