Taiwanese vs Immigrants from Kuwait GED/Equivalency
COMPARE
Taiwanese
Immigrants from Kuwait
GED/Equivalency
GED/Equivalency Comparison
Taiwanese
Immigrants from Kuwait
84.7%
GED/EQUIVALENCY
8.1/ 100
METRIC RATING
221st/ 347
METRIC RANK
87.7%
GED/EQUIVALENCY
98.8/ 100
METRIC RATING
74th/ 347
METRIC RANK
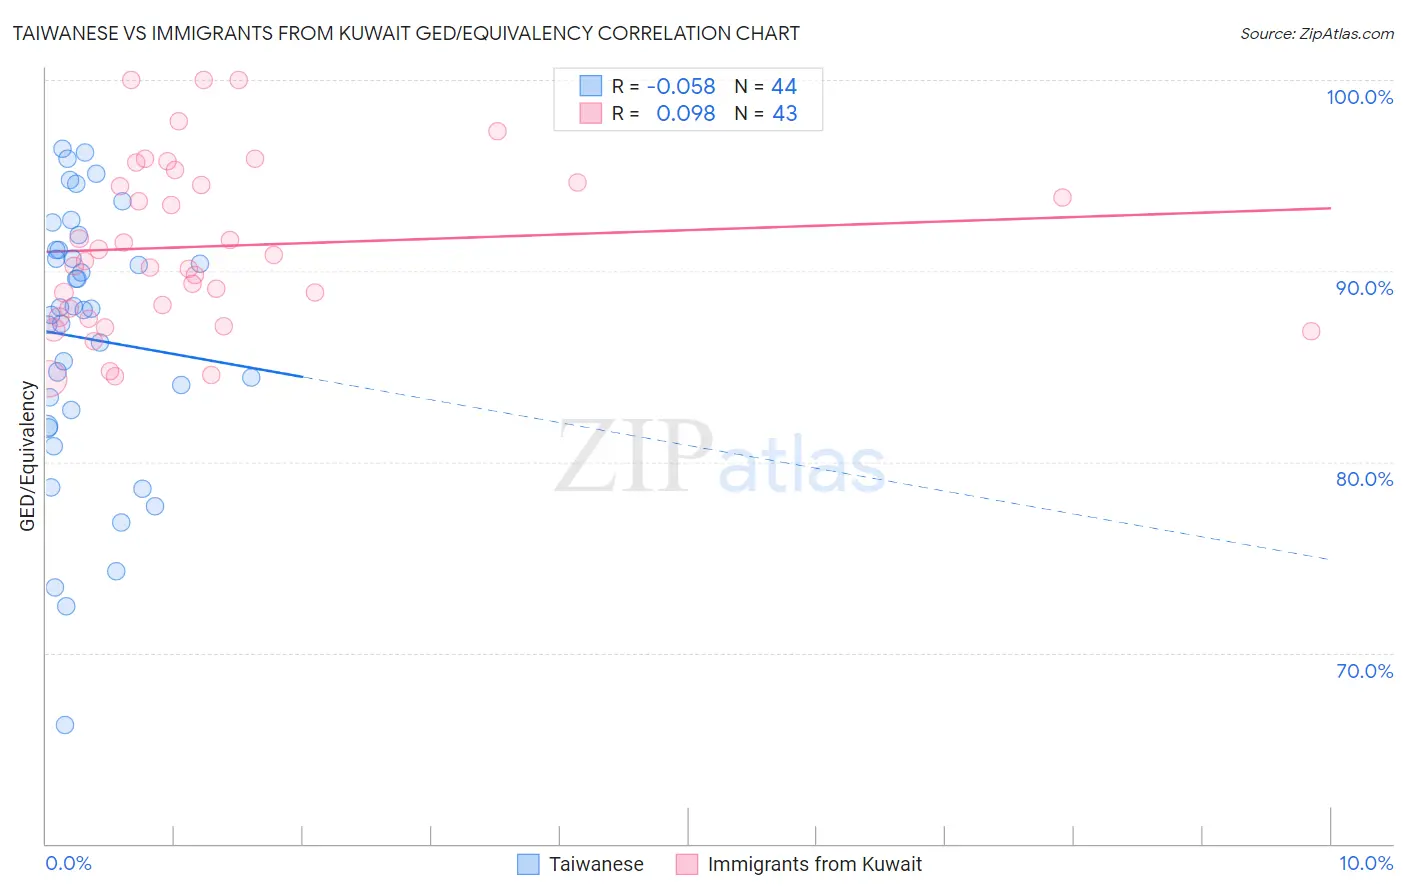
Taiwanese vs Immigrants from Kuwait GED/Equivalency Correlation Chart
The statistical analysis conducted on geographies consisting of 31,724,936 people shows a slight negative correlation between the proportion of Taiwanese and percentage of population with at least ged/equivalency education in the United States with a correlation coefficient (R) of -0.058 and weighted average of 84.7%. Similarly, the statistical analysis conducted on geographies consisting of 136,917,085 people shows a slight positive correlation between the proportion of Immigrants from Kuwait and percentage of population with at least ged/equivalency education in the United States with a correlation coefficient (R) of 0.098 and weighted average of 87.7%, a difference of 3.5%.
GED/Equivalency Correlation Summary
| Measurement | Taiwanese | Immigrants from Kuwait |
| Minimum | 66.2% | 84.4% |
| Maximum | 96.4% | 100.0% |
| Range | 30.1% | 15.6% |
| Mean | 86.5% | 91.3% |
| Median | 88.0% | 90.5% |
| Interquartile 25% (IQ1) | 82.3% | 87.6% |
| Interquartile 75% (IQ3) | 91.1% | 94.6% |
| Interquartile Range (IQR) | 8.8% | 7.0% |
| Standard Deviation (Sample) | 7.0% | 4.4% |
| Standard Deviation (Population) | 7.0% | 4.3% |
Similar Demographics by GED/Equivalency
Demographics Similar to Taiwanese by GED/Equivalency
In terms of ged/equivalency, the demographic groups most similar to Taiwanese are Potawatomi (84.7%, a difference of 0.010%), American (84.7%, a difference of 0.010%), Immigrants from Micronesia (84.7%, a difference of 0.040%), Nigerian (84.7%, a difference of 0.040%), and Alaska Native (84.7%, a difference of 0.040%).
| Demographics | Rating | Rank | GED/Equivalency |
| Osage | 9.5 /100 | #214 | Tragic 84.8% |
| Peruvians | 9.2 /100 | #215 | Tragic 84.7% |
| Immigrants | Micronesia | 8.7 /100 | #216 | Tragic 84.7% |
| Nigerians | 8.6 /100 | #217 | Tragic 84.7% |
| Alaska Natives | 8.6 /100 | #218 | Tragic 84.7% |
| Potawatomi | 8.2 /100 | #219 | Tragic 84.7% |
| Americans | 8.2 /100 | #220 | Tragic 84.7% |
| Taiwanese | 8.1 /100 | #221 | Tragic 84.7% |
| Iroquois | 7.5 /100 | #222 | Tragic 84.6% |
| Immigrants | Uzbekistan | 7.1 /100 | #223 | Tragic 84.6% |
| French American Indians | 6.3 /100 | #224 | Tragic 84.6% |
| Immigrants | Thailand | 5.8 /100 | #225 | Tragic 84.5% |
| Immigrants | Zaire | 5.5 /100 | #226 | Tragic 84.5% |
| Immigrants | Costa Rica | 5.4 /100 | #227 | Tragic 84.5% |
| Immigrants | Liberia | 4.9 /100 | #228 | Tragic 84.4% |
Demographics Similar to Immigrants from Kuwait by GED/Equivalency
In terms of ged/equivalency, the demographic groups most similar to Immigrants from Kuwait are Belgian (87.7%, a difference of 0.020%), Scottish (87.7%, a difference of 0.020%), Ukrainian (87.7%, a difference of 0.030%), Austrian (87.7%, a difference of 0.030%), and Immigrants from Moldova (87.7%, a difference of 0.030%).
| Demographics | Rating | Rank | GED/Equivalency |
| British | 99.1 /100 | #67 | Exceptional 87.8% |
| Immigrants | France | 99.1 /100 | #68 | Exceptional 87.8% |
| Immigrants | Saudi Arabia | 99.0 /100 | #69 | Exceptional 87.8% |
| Ukrainians | 98.8 /100 | #70 | Exceptional 87.7% |
| Austrians | 98.8 /100 | #71 | Exceptional 87.7% |
| Immigrants | Moldova | 98.8 /100 | #72 | Exceptional 87.7% |
| Belgians | 98.8 /100 | #73 | Exceptional 87.7% |
| Immigrants | Kuwait | 98.8 /100 | #74 | Exceptional 87.7% |
| Scottish | 98.7 /100 | #75 | Exceptional 87.7% |
| Immigrants | Serbia | 98.7 /100 | #76 | Exceptional 87.7% |
| Slavs | 98.7 /100 | #77 | Exceptional 87.7% |
| Irish | 98.6 /100 | #78 | Exceptional 87.6% |
| English | 98.6 /100 | #79 | Exceptional 87.6% |
| Immigrants | England | 98.5 /100 | #80 | Exceptional 87.6% |
| Immigrants | Sri Lanka | 98.3 /100 | #81 | Exceptional 87.5% |