New Zealander vs Immigrants from Vietnam GED/Equivalency
COMPARE
New Zealander
Immigrants from Vietnam
GED/Equivalency
GED/Equivalency Comparison
New Zealanders
Immigrants from Vietnam
88.0%
GED/EQUIVALENCY
99.4/ 100
METRIC RATING
55th/ 347
METRIC RANK
83.2%
GED/EQUIVALENCY
0.3/ 100
METRIC RATING
259th/ 347
METRIC RANK
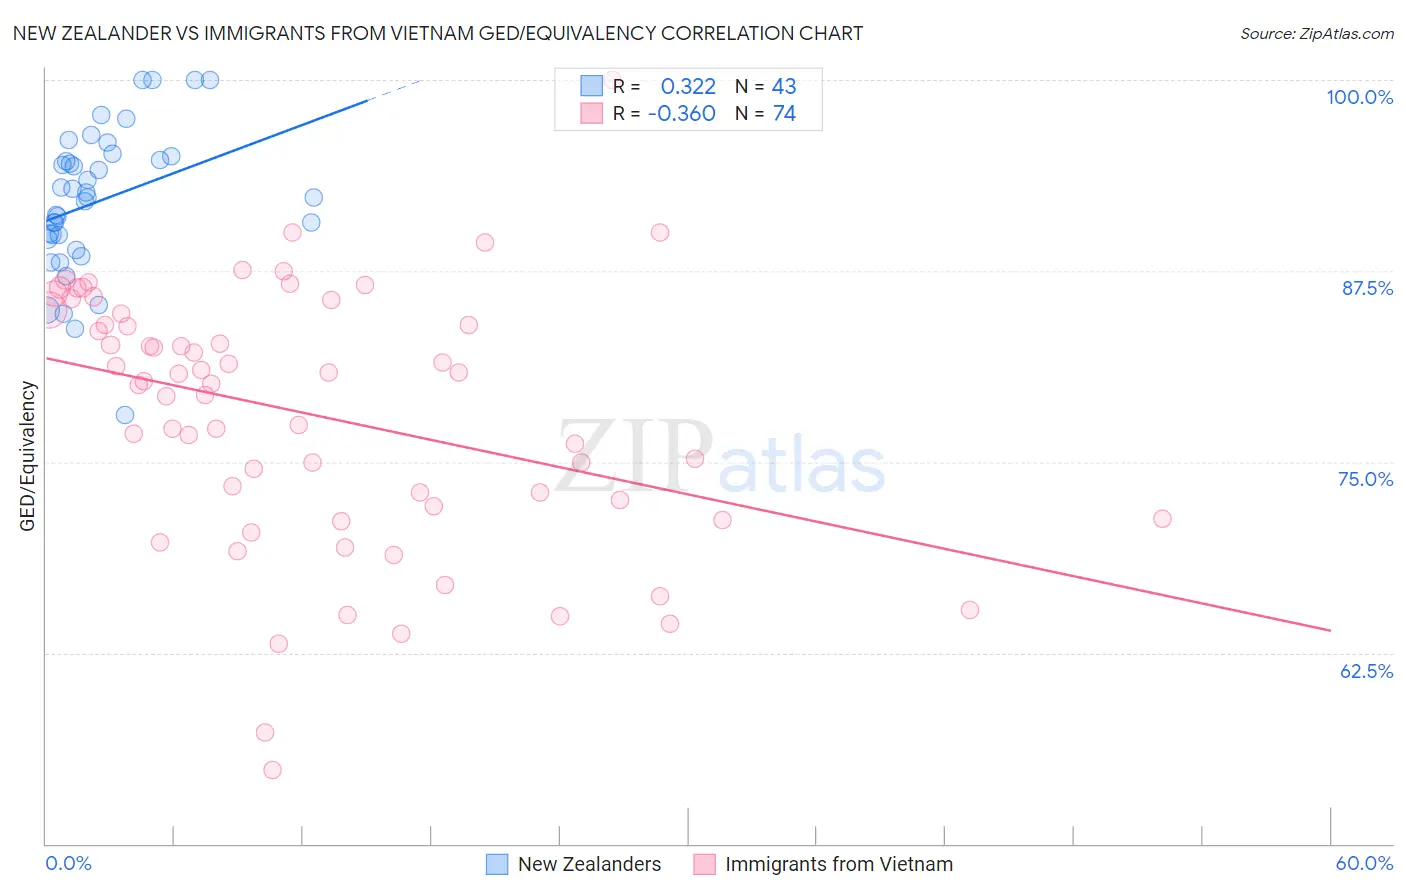
New Zealander vs Immigrants from Vietnam GED/Equivalency Correlation Chart
The statistical analysis conducted on geographies consisting of 106,911,650 people shows a mild positive correlation between the proportion of New Zealanders and percentage of population with at least ged/equivalency education in the United States with a correlation coefficient (R) of 0.322 and weighted average of 88.0%. Similarly, the statistical analysis conducted on geographies consisting of 404,843,872 people shows a mild negative correlation between the proportion of Immigrants from Vietnam and percentage of population with at least ged/equivalency education in the United States with a correlation coefficient (R) of -0.360 and weighted average of 83.2%, a difference of 5.8%.
GED/Equivalency Correlation Summary
| Measurement | New Zealander | Immigrants from Vietnam |
| Minimum | 78.1% | 54.8% |
| Maximum | 100.0% | 100.0% |
| Range | 21.9% | 45.2% |
| Mean | 92.1% | 78.1% |
| Median | 92.3% | 80.2% |
| Interquartile 25% (IQ1) | 89.6% | 72.1% |
| Interquartile 75% (IQ3) | 95.0% | 84.7% |
| Interquartile Range (IQR) | 5.4% | 12.6% |
| Standard Deviation (Sample) | 4.7% | 8.5% |
| Standard Deviation (Population) | 4.7% | 8.5% |
Similar Demographics by GED/Equivalency
Demographics Similar to New Zealanders by GED/Equivalency
In terms of ged/equivalency, the demographic groups most similar to New Zealanders are Soviet Union (88.0%, a difference of 0.0%), Zimbabwean (88.0%, a difference of 0.010%), Immigrants from South Africa (88.0%, a difference of 0.010%), Immigrants from Netherlands (88.0%, a difference of 0.020%), and Immigrants from Denmark (88.0%, a difference of 0.020%).
| Demographics | Rating | Rank | GED/Equivalency |
| Greeks | 99.5 /100 | #48 | Exceptional 88.1% |
| Australians | 99.5 /100 | #49 | Exceptional 88.1% |
| Immigrants | Korea | 99.5 /100 | #50 | Exceptional 88.1% |
| Immigrants | Netherlands | 99.4 /100 | #51 | Exceptional 88.0% |
| Zimbabweans | 99.4 /100 | #52 | Exceptional 88.0% |
| Immigrants | South Africa | 99.4 /100 | #53 | Exceptional 88.0% |
| Soviet Union | 99.4 /100 | #54 | Exceptional 88.0% |
| New Zealanders | 99.4 /100 | #55 | Exceptional 88.0% |
| Immigrants | Denmark | 99.4 /100 | #56 | Exceptional 88.0% |
| Immigrants | Czechoslovakia | 99.3 /100 | #57 | Exceptional 87.9% |
| Northern Europeans | 99.3 /100 | #58 | Exceptional 87.9% |
| Serbians | 99.3 /100 | #59 | Exceptional 87.9% |
| Scandinavians | 99.3 /100 | #60 | Exceptional 87.9% |
| Europeans | 99.3 /100 | #61 | Exceptional 87.9% |
| Germans | 99.3 /100 | #62 | Exceptional 87.9% |
Demographics Similar to Immigrants from Vietnam by GED/Equivalency
In terms of ged/equivalency, the demographic groups most similar to Immigrants from Vietnam are Choctaw (83.1%, a difference of 0.030%), Inupiat (83.1%, a difference of 0.090%), Immigrants from Armenia (83.1%, a difference of 0.090%), Immigrants from Congo (83.1%, a difference of 0.10%), and Bangladeshi (83.1%, a difference of 0.11%).
| Demographics | Rating | Rank | GED/Equivalency |
| Bahamians | 0.8 /100 | #252 | Tragic 83.6% |
| Comanche | 0.7 /100 | #253 | Tragic 83.6% |
| Creek | 0.7 /100 | #254 | Tragic 83.6% |
| Colville | 0.5 /100 | #255 | Tragic 83.4% |
| Africans | 0.5 /100 | #256 | Tragic 83.4% |
| Jamaicans | 0.4 /100 | #257 | Tragic 83.3% |
| Malaysians | 0.4 /100 | #258 | Tragic 83.3% |
| Immigrants | Vietnam | 0.3 /100 | #259 | Tragic 83.2% |
| Choctaw | 0.3 /100 | #260 | Tragic 83.1% |
| Inupiat | 0.2 /100 | #261 | Tragic 83.1% |
| Immigrants | Armenia | 0.2 /100 | #262 | Tragic 83.1% |
| Immigrants | Congo | 0.2 /100 | #263 | Tragic 83.1% |
| Bangladeshis | 0.2 /100 | #264 | Tragic 83.1% |
| West Indians | 0.2 /100 | #265 | Tragic 83.1% |
| Kiowa | 0.2 /100 | #266 | Tragic 83.1% |