Immigrants from Lebanon vs Immigrants from Lithuania GED/Equivalency
COMPARE
Immigrants from Lebanon
Immigrants from Lithuania
GED/Equivalency
GED/Equivalency Comparison
Immigrants from Lebanon
Immigrants from Lithuania
86.8%
GED/EQUIVALENCY
90.9/ 100
METRIC RATING
121st/ 347
METRIC RANK
88.6%
GED/EQUIVALENCY
99.8/ 100
METRIC RATING
27th/ 347
METRIC RANK
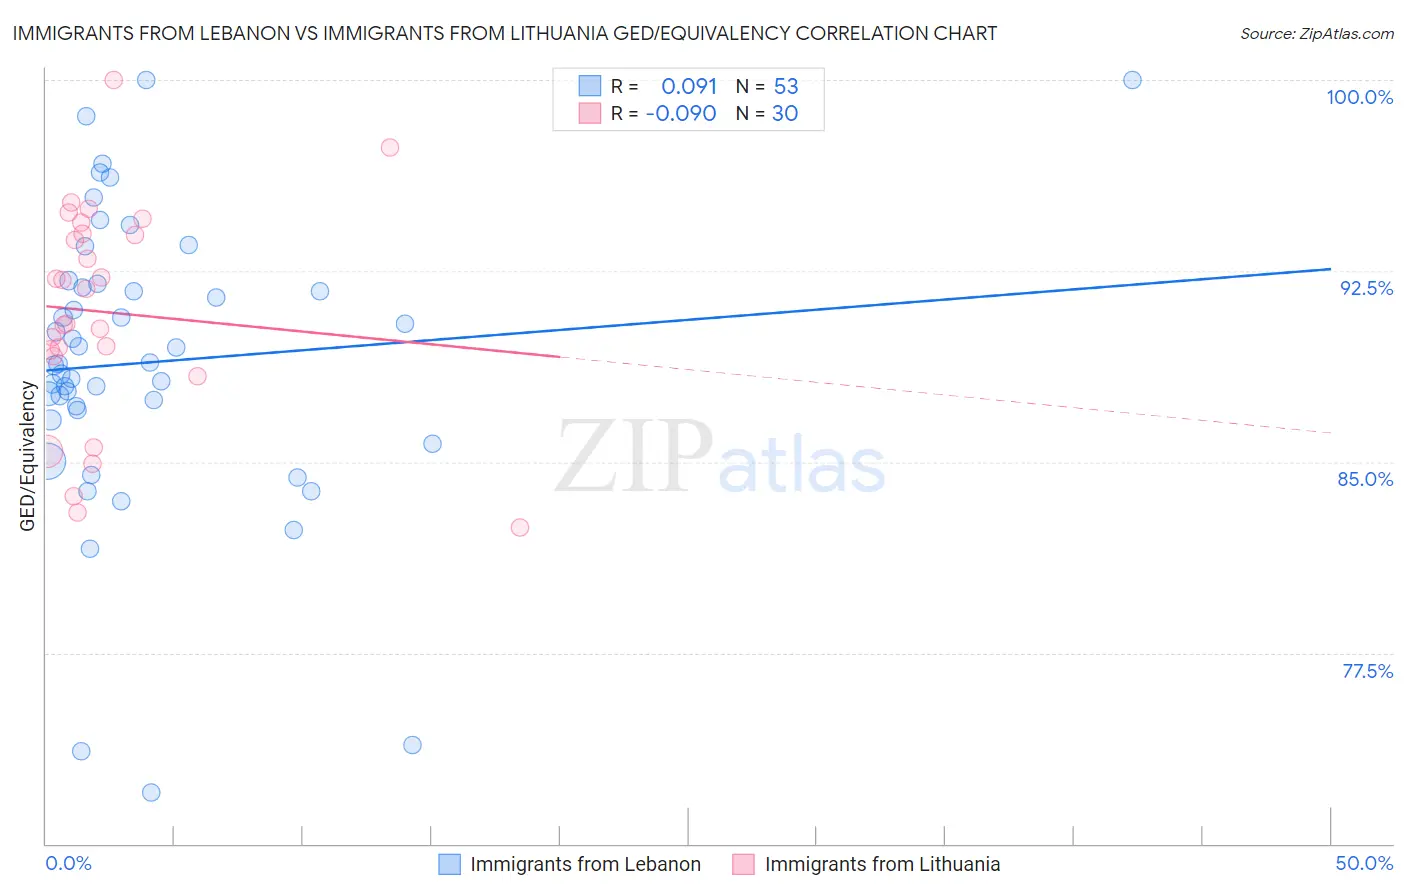
Immigrants from Lebanon vs Immigrants from Lithuania GED/Equivalency Correlation Chart
The statistical analysis conducted on geographies consisting of 217,164,247 people shows a slight positive correlation between the proportion of Immigrants from Lebanon and percentage of population with at least ged/equivalency education in the United States with a correlation coefficient (R) of 0.091 and weighted average of 86.8%. Similarly, the statistical analysis conducted on geographies consisting of 117,724,932 people shows a slight negative correlation between the proportion of Immigrants from Lithuania and percentage of population with at least ged/equivalency education in the United States with a correlation coefficient (R) of -0.090 and weighted average of 88.6%, a difference of 2.1%.
GED/Equivalency Correlation Summary
| Measurement | Immigrants from Lebanon | Immigrants from Lithuania |
| Minimum | 72.0% | 82.4% |
| Maximum | 100.0% | 100.0% |
| Range | 28.0% | 17.6% |
| Mean | 88.9% | 90.9% |
| Median | 88.9% | 91.1% |
| Interquartile 25% (IQ1) | 86.8% | 89.2% |
| Interquartile 75% (IQ3) | 91.9% | 94.0% |
| Interquartile Range (IQR) | 5.1% | 4.8% |
| Standard Deviation (Sample) | 5.8% | 4.3% |
| Standard Deviation (Population) | 5.7% | 4.2% |
Similar Demographics by GED/Equivalency
Demographics Similar to Immigrants from Lebanon by GED/Equivalency
In terms of ged/equivalency, the demographic groups most similar to Immigrants from Lebanon are Immigrants from Jordan (86.8%, a difference of 0.0%), Immigrants from Italy (86.7%, a difference of 0.020%), Immigrants from Egypt (86.7%, a difference of 0.030%), Celtic (86.7%, a difference of 0.030%), and Asian (86.7%, a difference of 0.040%).
| Demographics | Rating | Rank | GED/Equivalency |
| Immigrants | Kazakhstan | 94.7 /100 | #114 | Exceptional 87.0% |
| Mongolians | 94.6 /100 | #115 | Exceptional 87.0% |
| Swiss | 94.5 /100 | #116 | Exceptional 87.0% |
| Immigrants | Hong Kong | 93.8 /100 | #117 | Exceptional 86.9% |
| French Canadians | 93.2 /100 | #118 | Exceptional 86.9% |
| Immigrants | China | 93.2 /100 | #119 | Exceptional 86.9% |
| Scotch-Irish | 91.6 /100 | #120 | Exceptional 86.8% |
| Immigrants | Lebanon | 90.9 /100 | #121 | Exceptional 86.8% |
| Immigrants | Jordan | 90.8 /100 | #122 | Exceptional 86.8% |
| Immigrants | Italy | 90.5 /100 | #123 | Exceptional 86.7% |
| Immigrants | Egypt | 90.4 /100 | #124 | Exceptional 86.7% |
| Celtics | 90.4 /100 | #125 | Exceptional 86.7% |
| Asians | 90.3 /100 | #126 | Exceptional 86.7% |
| Argentineans | 89.7 /100 | #127 | Excellent 86.7% |
| Yugoslavians | 89.5 /100 | #128 | Excellent 86.7% |
Demographics Similar to Immigrants from Lithuania by GED/Equivalency
In terms of ged/equivalency, the demographic groups most similar to Immigrants from Lithuania are Immigrants from Australia (88.6%, a difference of 0.030%), Russian (88.6%, a difference of 0.040%), Slovak (88.6%, a difference of 0.040%), Estonian (88.6%, a difference of 0.040%), and Immigrants from Northern Europe (88.5%, a difference of 0.040%).
| Demographics | Rating | Rank | GED/Equivalency |
| Maltese | 99.9 /100 | #20 | Exceptional 88.6% |
| Luxembourgers | 99.8 /100 | #21 | Exceptional 88.6% |
| Immigrants | Ireland | 99.8 /100 | #22 | Exceptional 88.6% |
| Russians | 99.8 /100 | #23 | Exceptional 88.6% |
| Slovaks | 99.8 /100 | #24 | Exceptional 88.6% |
| Estonians | 99.8 /100 | #25 | Exceptional 88.6% |
| Immigrants | Australia | 99.8 /100 | #26 | Exceptional 88.6% |
| Immigrants | Lithuania | 99.8 /100 | #27 | Exceptional 88.6% |
| Immigrants | Northern Europe | 99.8 /100 | #28 | Exceptional 88.5% |
| Poles | 99.8 /100 | #29 | Exceptional 88.5% |
| Turks | 99.8 /100 | #30 | Exceptional 88.5% |
| Bhutanese | 99.8 /100 | #31 | Exceptional 88.4% |
| Danes | 99.8 /100 | #32 | Exceptional 88.4% |
| Immigrants | Sweden | 99.7 /100 | #33 | Exceptional 88.4% |
| Immigrants | Japan | 99.7 /100 | #34 | Exceptional 88.4% |