Zip Codes with the Highest Percentage of Population Employed in Accommodation & Food Services in Englewood, CO
RELATED REPORTS & OPTIONS
Accommodation & Food Services
Englewood
Compare Zip Codes
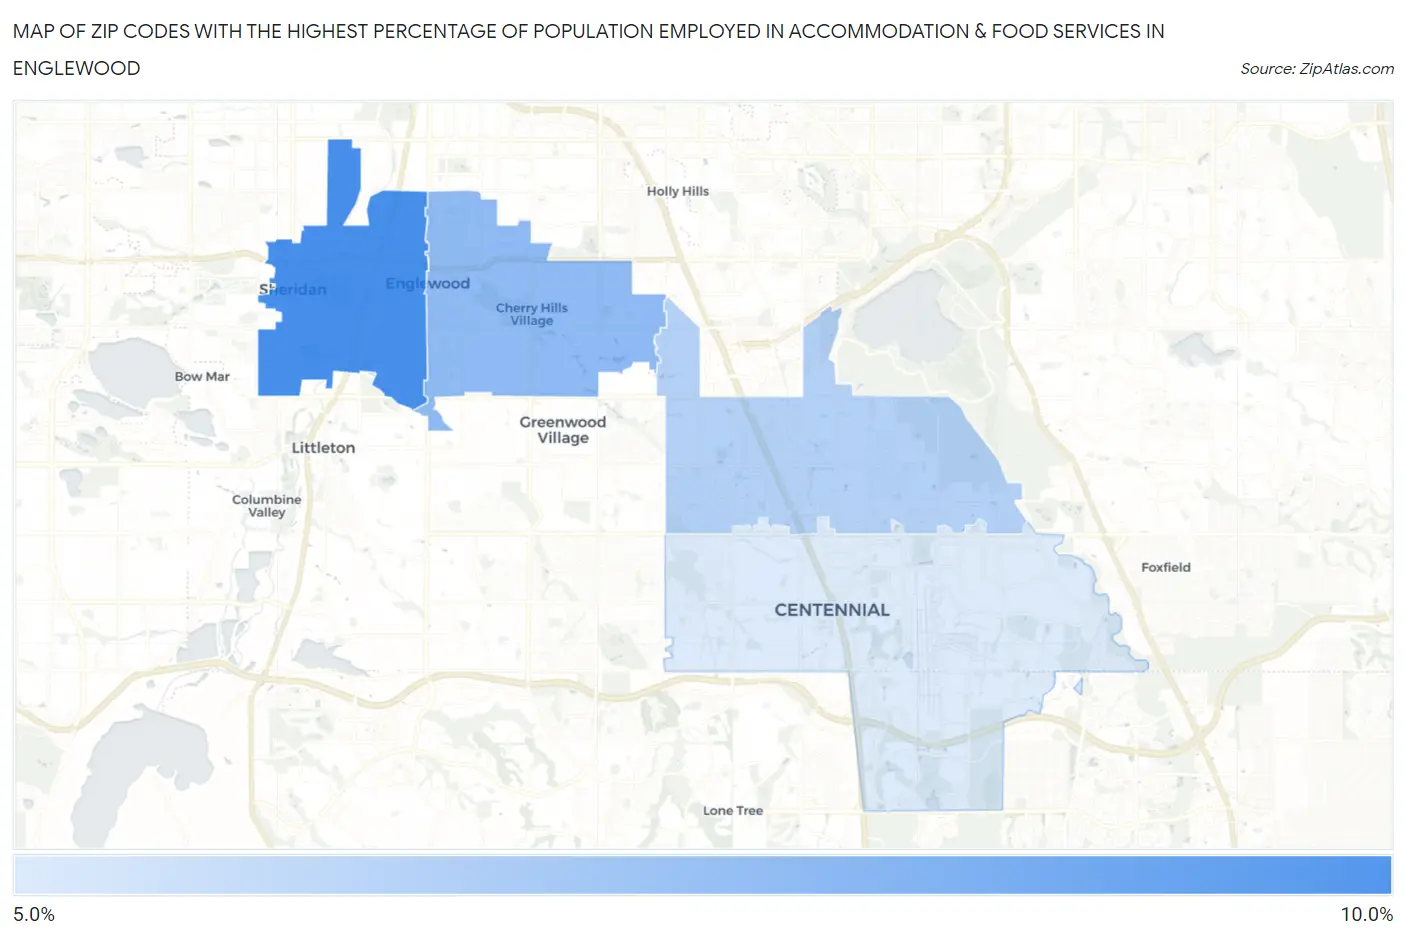
Map of Zip Codes with the Highest Percentage of Population Employed in Accommodation & Food Services in Englewood
5.5%
8.9%
Zip Codes with the Highest Percentage of Population Employed in Accommodation & Food Services in Englewood, CO
| Zip Code | % Employed | vs State | vs National | |
| 1. | 80110 | 8.9% | 6.9%(+2.01)#114 | 6.9%(+2.03)#6,103 |
| 2. | 80113 | 7.2% | 6.9%(+0.345)#165 | 6.9%(+0.365)#9,685 |
| 3. | 80111 | 6.4% | 6.9%(-0.491)#200 | 6.9%(-0.470)#12,124 |
| 4. | 80112 | 5.5% | 6.9%(-1.41)#252 | 6.9%(-1.39)#15,088 |
1
Common Questions
What are the Top 3 Zip Codes with the Highest Percentage of Population Employed in Accommodation & Food Services in Englewood, CO?
Top 3 Zip Codes with the Highest Percentage of Population Employed in Accommodation & Food Services in Englewood, CO are:
What zip code has the Highest Percentage of Population Employed in Accommodation & Food Services in Englewood, CO?
80110 has the Highest Percentage of Population Employed in Accommodation & Food Services in Englewood, CO with 8.9%.
What is the Percentage of Population Employed in Accommodation & Food Services in Englewood, CO?
Percentage of Population Employed in Accommodation & Food Services in Englewood is 8.4%.
What is the Percentage of Population Employed in Accommodation & Food Services in Colorado?
Percentage of Population Employed in Accommodation & Food Services in Colorado is 6.9%.
What is the Percentage of Population Employed in Accommodation & Food Services in the United States?
Percentage of Population Employed in Accommodation & Food Services in the United States is 6.9%.