Zip Codes with the Highest Percentage of Population Employed in Office & Administration in Englewood, CO
RELATED REPORTS & OPTIONS
Office & Administration
Englewood
Compare Zip Codes
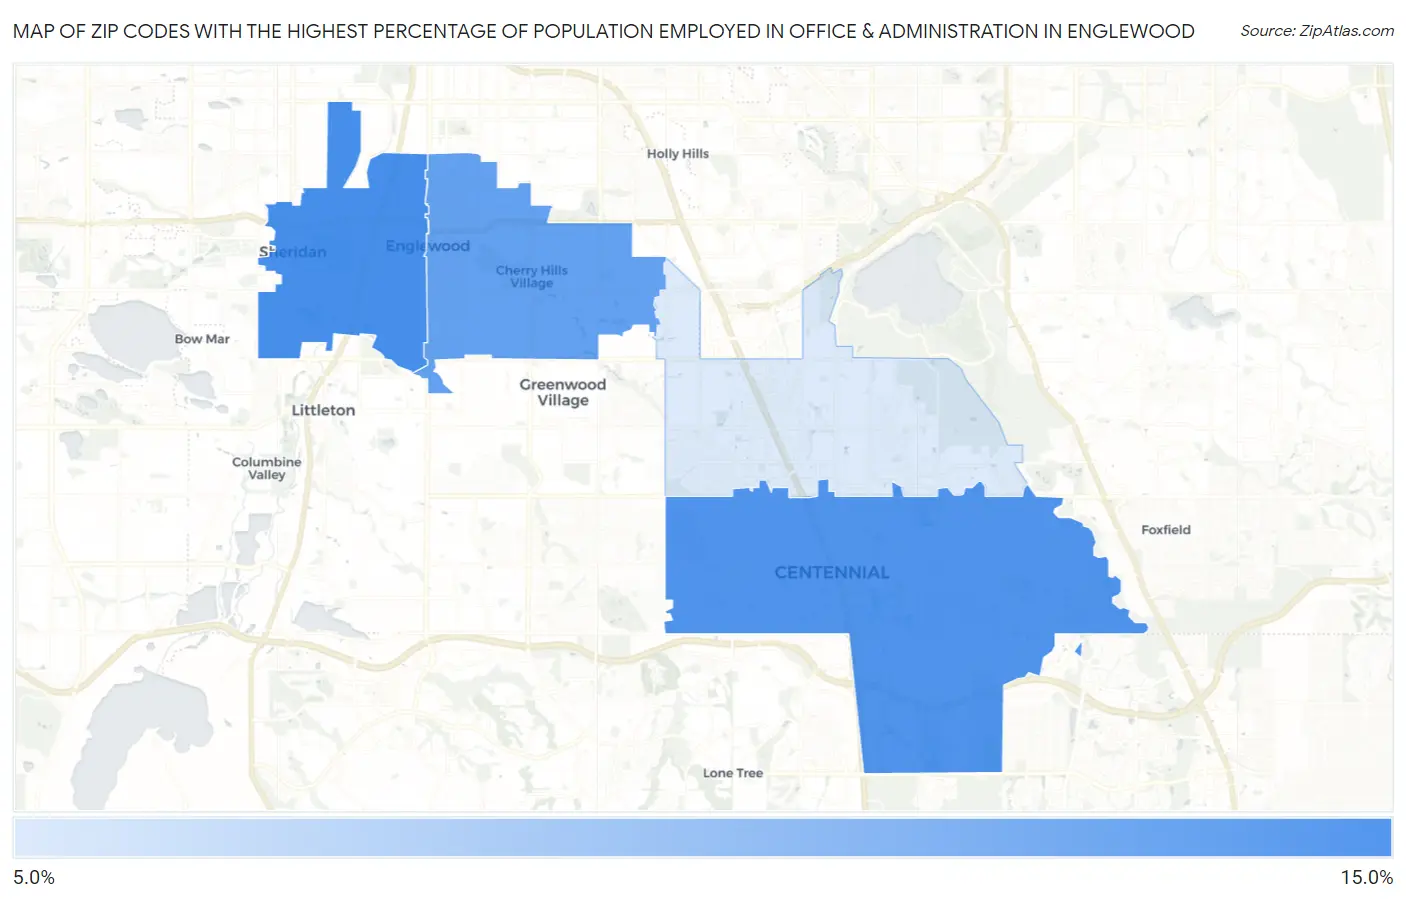
Map of Zip Codes with the Highest Percentage of Population Employed in Office & Administration in Englewood
7.6%
10.5%
Zip Codes with the Highest Percentage of Population Employed in Office & Administration in Englewood, CO
| Zip Code | % Employed | vs State | vs National | |
| 1. | 80110 | 10.5% | 10.1%(+0.387)#193 | 10.9%(-0.339)#15,415 |
| 2. | 80112 | 10.3% | 10.1%(+0.216)#206 | 10.9%(-0.510)#16,004 |
| 3. | 80113 | 10.0% | 10.1%(-0.163)#223 | 10.9%(-0.889)#17,237 |
| 4. | 80111 | 7.6% | 10.1%(-2.51)#338 | 10.9%(-3.24)#23,889 |
1
Common Questions
What are the Top 3 Zip Codes with the Highest Percentage of Population Employed in Office & Administration in Englewood, CO?
Top 3 Zip Codes with the Highest Percentage of Population Employed in Office & Administration in Englewood, CO are:
What zip code has the Highest Percentage of Population Employed in Office & Administration in Englewood, CO?
80110 has the Highest Percentage of Population Employed in Office & Administration in Englewood, CO with 10.5%.
What is the Percentage of Population Employed in Office & Administration in Englewood, CO?
Percentage of Population Employed in Office & Administration in Englewood is 10.7%.
What is the Percentage of Population Employed in Office & Administration in Colorado?
Percentage of Population Employed in Office & Administration in Colorado is 10.1%.
What is the Percentage of Population Employed in Office & Administration in the United States?
Percentage of Population Employed in Office & Administration in the United States is 10.9%.