Zip Codes with the Highest Percentage of Population with a Degree in Arts and Humanities in Englewood, CO
RELATED REPORTS & OPTIONS
Arts and Humanities
Englewood
Compare Zip Codes
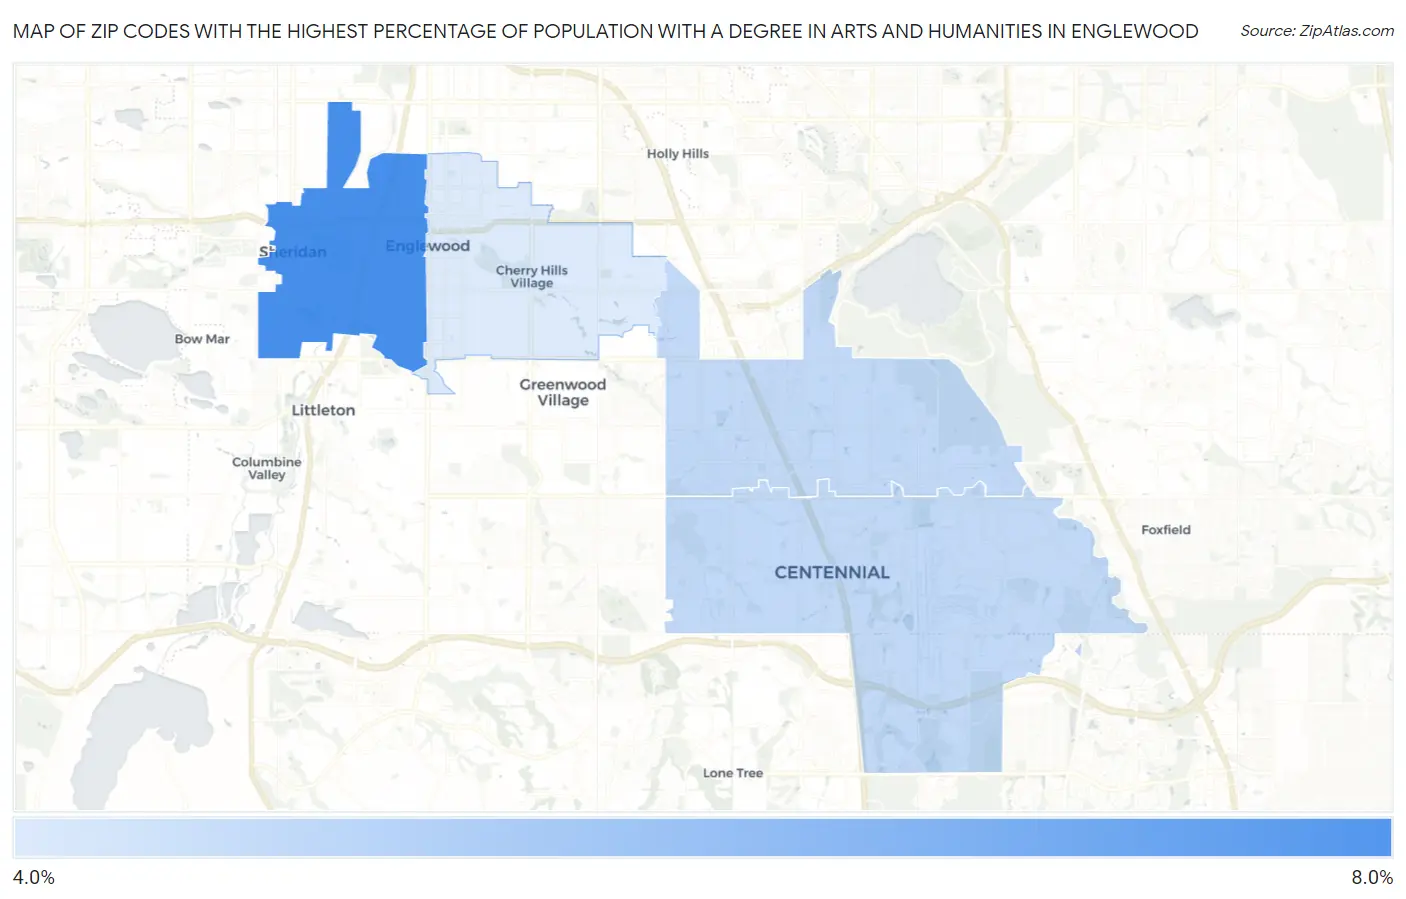
Map of Zip Codes with the Highest Percentage of Population with a Degree in Arts and Humanities in Englewood
4.7%
7.2%
Zip Codes with the Highest Percentage of Population with a Degree in Arts and Humanities in Englewood, CO
| Zip Code | % Graduates | vs State | vs National | |
| 1. | 80110 | 7.2% | 5.9%(+1.32)#155 | 6.0%(+1.22)#11,425 |
| 2. | 80112 | 5.1% | 5.9%(-0.755)#265 | 6.0%(-0.856)#17,195 |
| 3. | 80111 | 5.1% | 5.9%(-0.766)#266 | 6.0%(-0.866)#17,216 |
| 4. | 80113 | 4.7% | 5.9%(-1.22)#292 | 6.0%(-1.32)#18,511 |
1
Common Questions
What are the Top 3 Zip Codes with the Highest Percentage of Population with a Degree in Arts and Humanities in Englewood, CO?
Top 3 Zip Codes with the Highest Percentage of Population with a Degree in Arts and Humanities in Englewood, CO are:
What zip code has the Highest Percentage of Population with a Degree in Arts and Humanities in Englewood, CO?
80110 has the Highest Percentage of Population with a Degree in Arts and Humanities in Englewood, CO with 7.2%.
What is the Percentage of Population with a Degree in Arts and Humanities in Englewood, CO?
Percentage of Population with a Degree in Arts and Humanities in Englewood is 6.1%.
What is the Percentage of Population with a Degree in Arts and Humanities in Colorado?
Percentage of Population with a Degree in Arts and Humanities in Colorado is 5.9%.
What is the Percentage of Population with a Degree in Arts and Humanities in the United States?
Percentage of Population with a Degree in Arts and Humanities in the United States is 6.0%.