Zip Codes with the Highest Percentage of Population with a Degree in Science and Engineering in Englewood, CO
RELATED REPORTS & OPTIONS
Science and Engineering
Englewood
Compare Zip Codes
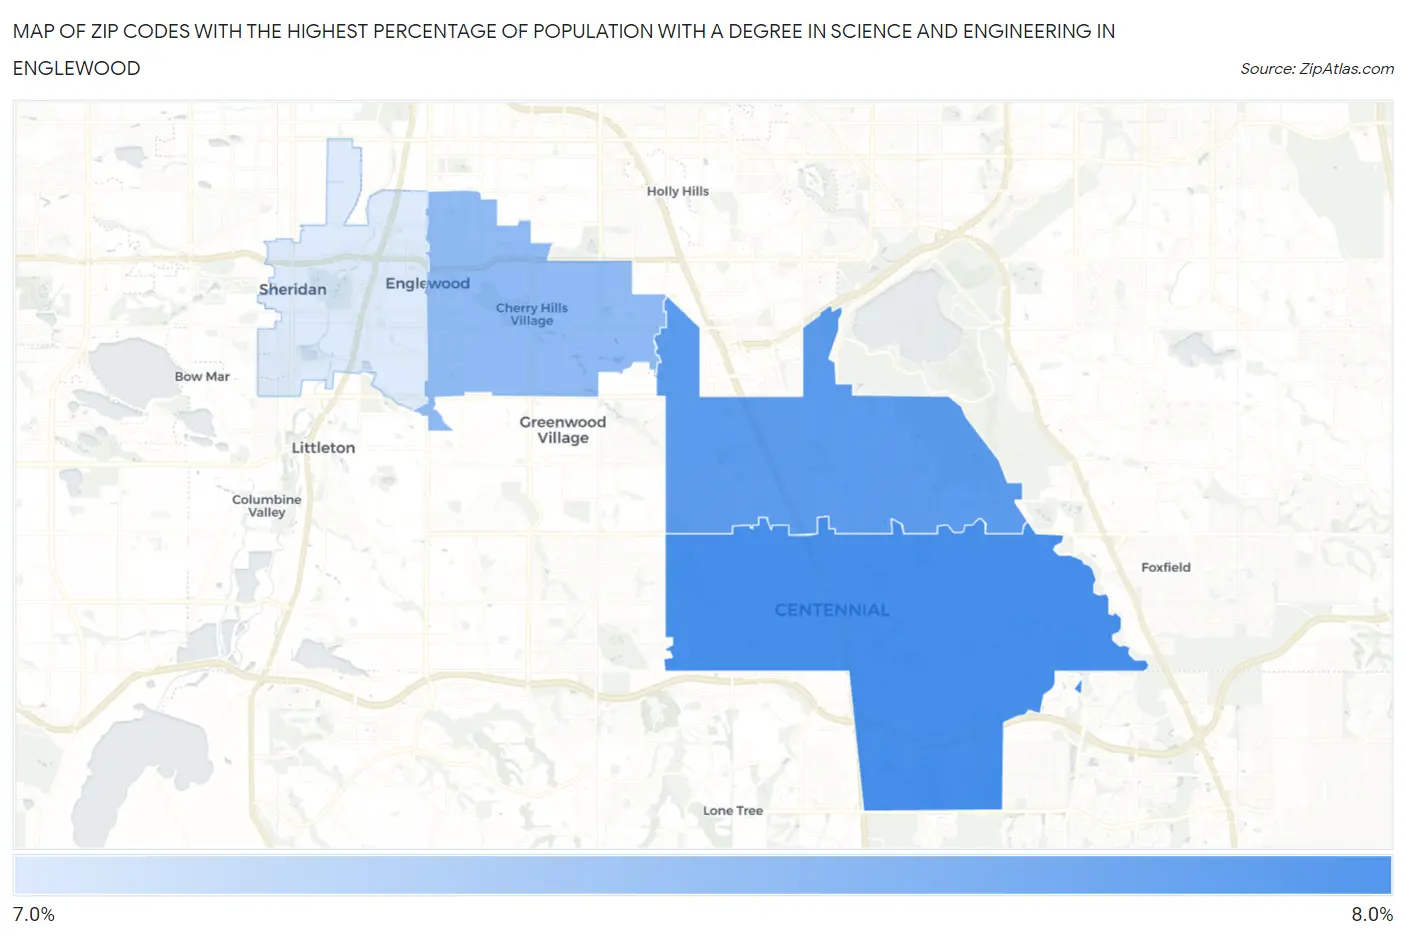
Map of Zip Codes with the Highest Percentage of Population with a Degree in Science and Engineering in Englewood
7.7%
7.9%
Zip Codes with the Highest Percentage of Population with a Degree in Science and Engineering in Englewood, CO
| Zip Code | % Graduates | vs State | vs National | |
| 1. | 80112 | 7.9% | 8.5%(-0.624)#257 | 9.8%(-1.93)#19,972 |
| 2. | 80111 | 7.8% | 8.5%(-0.643)#259 | 9.8%(-1.95)#20,015 |
| 3. | 80113 | 7.8% | 8.5%(-0.696)#263 | 9.8%(-2.00)#20,124 |
| 4. | 80110 | 7.7% | 8.5%(-0.776)#268 | 9.8%(-2.08)#20,291 |
1
Common Questions
What are the Top 3 Zip Codes with the Highest Percentage of Population with a Degree in Science and Engineering in Englewood, CO?
Top 3 Zip Codes with the Highest Percentage of Population with a Degree in Science and Engineering in Englewood, CO are:
What zip code has the Highest Percentage of Population with a Degree in Science and Engineering in Englewood, CO?
80112 has the Highest Percentage of Population with a Degree in Science and Engineering in Englewood, CO with 7.9%.
What is the Percentage of Population with a Degree in Science and Engineering in Englewood, CO?
Percentage of Population with a Degree in Science and Engineering in Englewood is 8.1%.
What is the Percentage of Population with a Degree in Science and Engineering in Colorado?
Percentage of Population with a Degree in Science and Engineering in Colorado is 8.5%.
What is the Percentage of Population with a Degree in Science and Engineering in the United States?
Percentage of Population with a Degree in Science and Engineering in the United States is 9.8%.