Zip Codes with the Highest Percentage of Population Employed in Installation, Maintenance & Repair in Englewood, CO
RELATED REPORTS & OPTIONS
Installation, Maintenance & Repair
Englewood
Compare Zip Codes
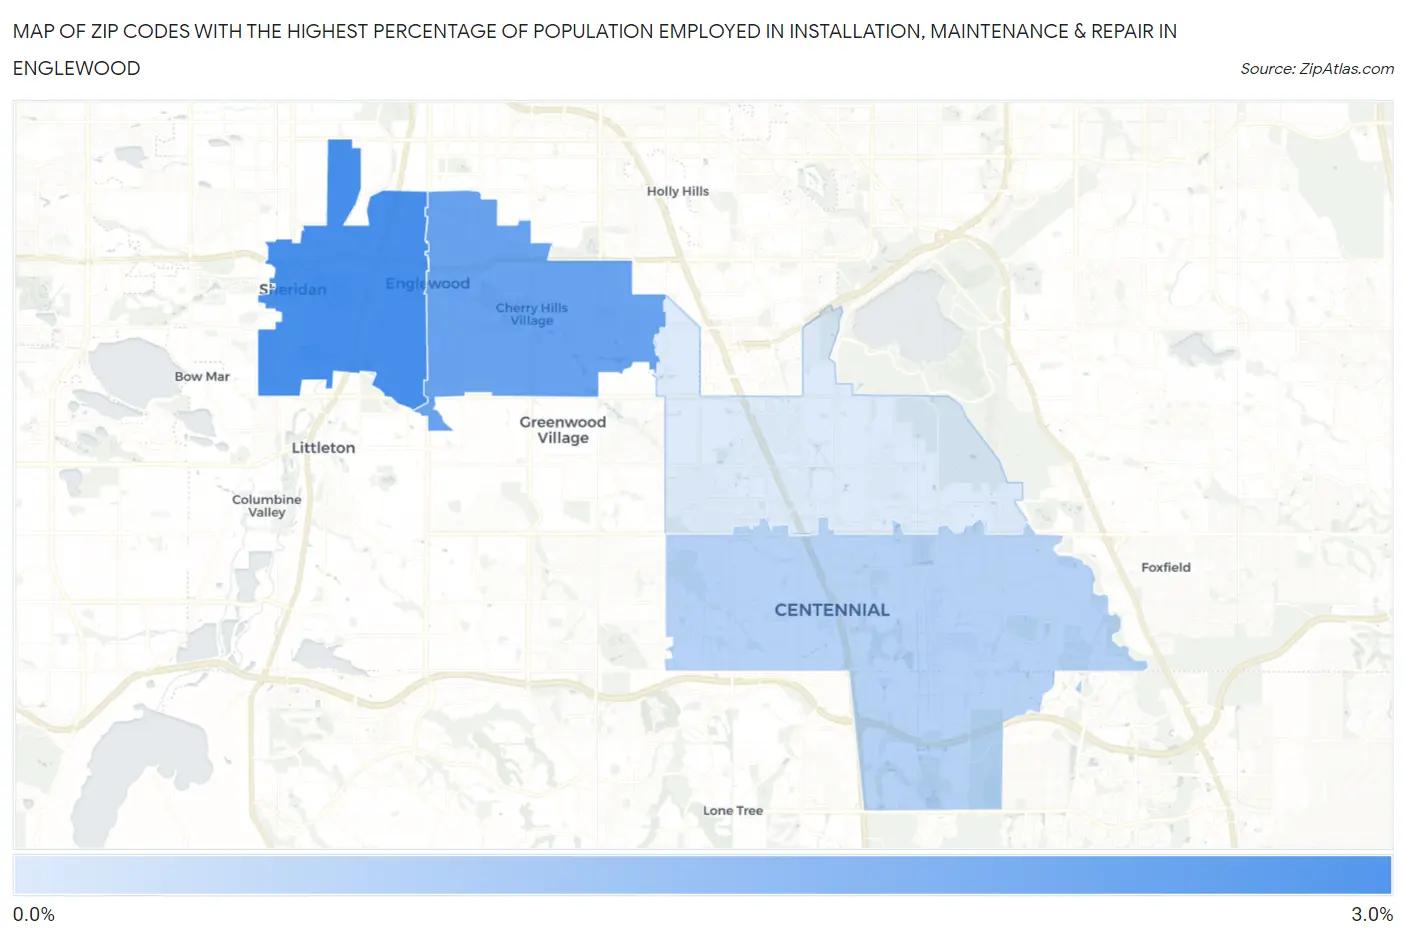
Map of Zip Codes with the Highest Percentage of Population Employed in Installation, Maintenance & Repair in Englewood
0.65%
2.7%
Zip Codes with the Highest Percentage of Population Employed in Installation, Maintenance & Repair in Englewood, CO
| Zip Code | % Employed | vs State | vs National | |
| 1. | 80110 | 2.7% | 2.8%(-0.164)#247 | 3.1%(-0.410)#18,774 |
| 2. | 80113 | 2.2% | 2.8%(-0.604)#293 | 3.1%(-0.850)#20,997 |
| 3. | 80112 | 1.2% | 2.8%(-1.64)#367 | 3.1%(-1.89)#25,344 |
| 4. | 80111 | 0.65% | 2.8%(-2.17)#398 | 3.1%(-2.41)#26,897 |
1
Common Questions
What are the Top 3 Zip Codes with the Highest Percentage of Population Employed in Installation, Maintenance & Repair in Englewood, CO?
Top 3 Zip Codes with the Highest Percentage of Population Employed in Installation, Maintenance & Repair in Englewood, CO are:
What zip code has the Highest Percentage of Population Employed in Installation, Maintenance & Repair in Englewood, CO?
80110 has the Highest Percentage of Population Employed in Installation, Maintenance & Repair in Englewood, CO with 2.7%.
What is the Percentage of Population Employed in Installation, Maintenance & Repair in Englewood, CO?
Percentage of Population Employed in Installation, Maintenance & Repair in Englewood is 2.6%.
What is the Percentage of Population Employed in Installation, Maintenance & Repair in Colorado?
Percentage of Population Employed in Installation, Maintenance & Repair in Colorado is 2.8%.
What is the Percentage of Population Employed in Installation, Maintenance & Repair in the United States?
Percentage of Population Employed in Installation, Maintenance & Repair in the United States is 3.1%.