Zip Codes with the Highest Percentage of Population Employed in Farming, Fishing & Forestry in Englewood, CO
RELATED REPORTS & OPTIONS
Farming, Fishing & Forestry
Englewood
Compare Zip Codes
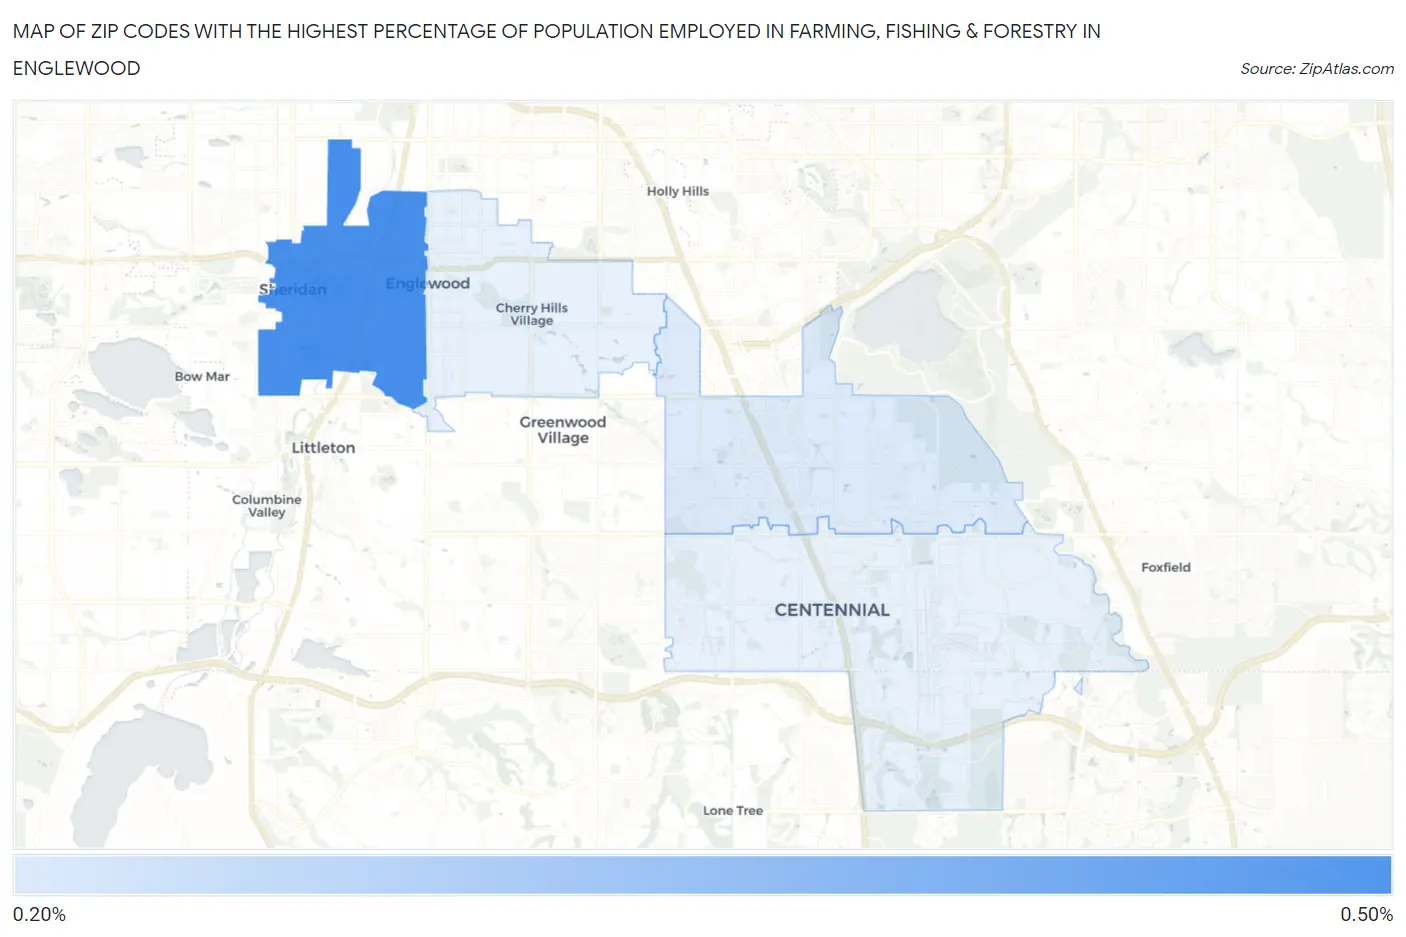
Map of Zip Codes with the Highest Percentage of Population Employed in Farming, Fishing & Forestry in Englewood
0.25%
0.42%
Zip Codes with the Highest Percentage of Population Employed in Farming, Fishing & Forestry in Englewood, CO
| Zip Code | % Employed | vs State | vs National | |
| 1. | 80110 | 0.42% | 0.49%(-0.065)#220 | 0.61%(-0.184)#13,574 |
| 2. | 80111 | 0.25% | 0.49%(-0.238)#257 | 0.61%(-0.356)#15,427 |
1
Common Questions
What are the Top 3 Zip Codes with the Highest Percentage of Population Employed in Farming, Fishing & Forestry in Englewood, CO?
Top 3 Zip Codes with the Highest Percentage of Population Employed in Farming, Fishing & Forestry in Englewood, CO are:
What zip code has the Highest Percentage of Population Employed in Farming, Fishing & Forestry in Englewood, CO?
80110 has the Highest Percentage of Population Employed in Farming, Fishing & Forestry in Englewood, CO with 0.42%.
What is the Percentage of Population Employed in Farming, Fishing & Forestry in Englewood, CO?
Percentage of Population Employed in Farming, Fishing & Forestry in Englewood is 0.27%.
What is the Percentage of Population Employed in Farming, Fishing & Forestry in Colorado?
Percentage of Population Employed in Farming, Fishing & Forestry in Colorado is 0.49%.
What is the Percentage of Population Employed in Farming, Fishing & Forestry in the United States?
Percentage of Population Employed in Farming, Fishing & Forestry in the United States is 0.61%.