Zip Codes with the Highest Percentage of Population Employed in Administrative & Support Services in Englewood, CO
RELATED REPORTS & OPTIONS
Administrative & Support Services
Englewood
Compare Zip Codes
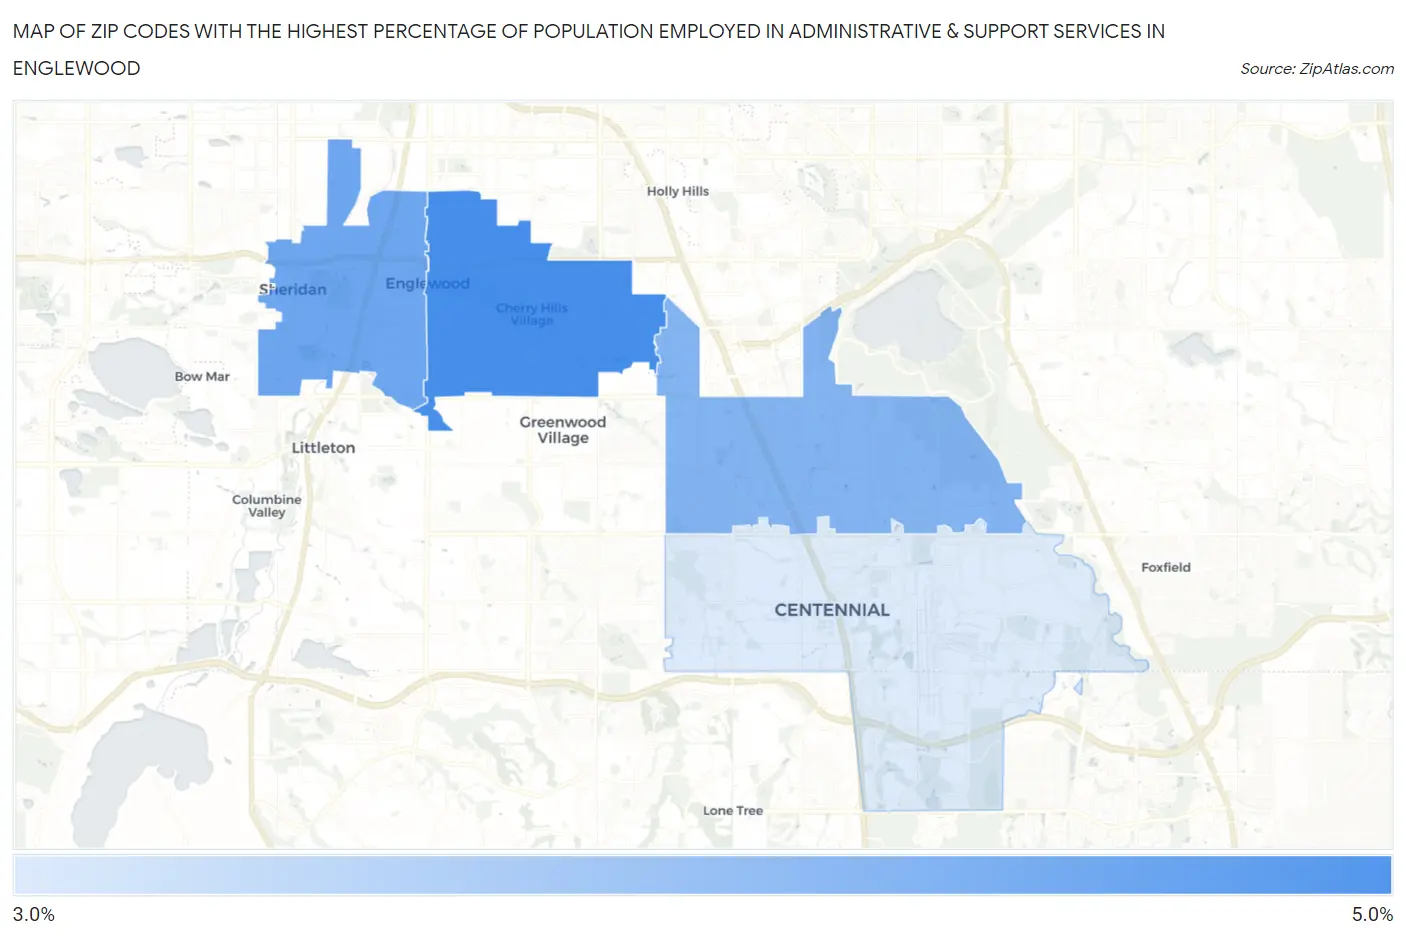
Map of Zip Codes with the Highest Percentage of Population Employed in Administrative & Support Services in Englewood
3.2%
4.6%
Zip Codes with the Highest Percentage of Population Employed in Administrative & Support Services in Englewood, CO
| Zip Code | % Employed | vs State | vs National | |
| 1. | 80113 | 4.6% | 4.1%(+0.498)#134 | 4.1%(+0.440)#8,410 |
| 2. | 80110 | 4.2% | 4.1%(+0.134)#151 | 4.1%(+0.075)#9,725 |
| 3. | 80111 | 4.0% | 4.1%(-0.052)#168 | 4.1%(-0.110)#10,517 |
| 4. | 80112 | 3.2% | 4.1%(-0.863)#222 | 4.1%(-0.921)#14,315 |
1
Common Questions
What are the Top 3 Zip Codes with the Highest Percentage of Population Employed in Administrative & Support Services in Englewood, CO?
Top 3 Zip Codes with the Highest Percentage of Population Employed in Administrative & Support Services in Englewood, CO are:
What zip code has the Highest Percentage of Population Employed in Administrative & Support Services in Englewood, CO?
80113 has the Highest Percentage of Population Employed in Administrative & Support Services in Englewood, CO with 4.6%.
What is the Percentage of Population Employed in Administrative & Support Services in Englewood, CO?
Percentage of Population Employed in Administrative & Support Services in Englewood is 4.9%.
What is the Percentage of Population Employed in Administrative & Support Services in Colorado?
Percentage of Population Employed in Administrative & Support Services in Colorado is 4.1%.
What is the Percentage of Population Employed in Administrative & Support Services in the United States?
Percentage of Population Employed in Administrative & Support Services in the United States is 4.1%.