Zip Codes with the Highest Percentage of Population Employed in Arts, Entertainment & Recreation in Englewood, CO
RELATED REPORTS & OPTIONS
Arts, Entertainment & Recreation
Englewood
Compare Zip Codes
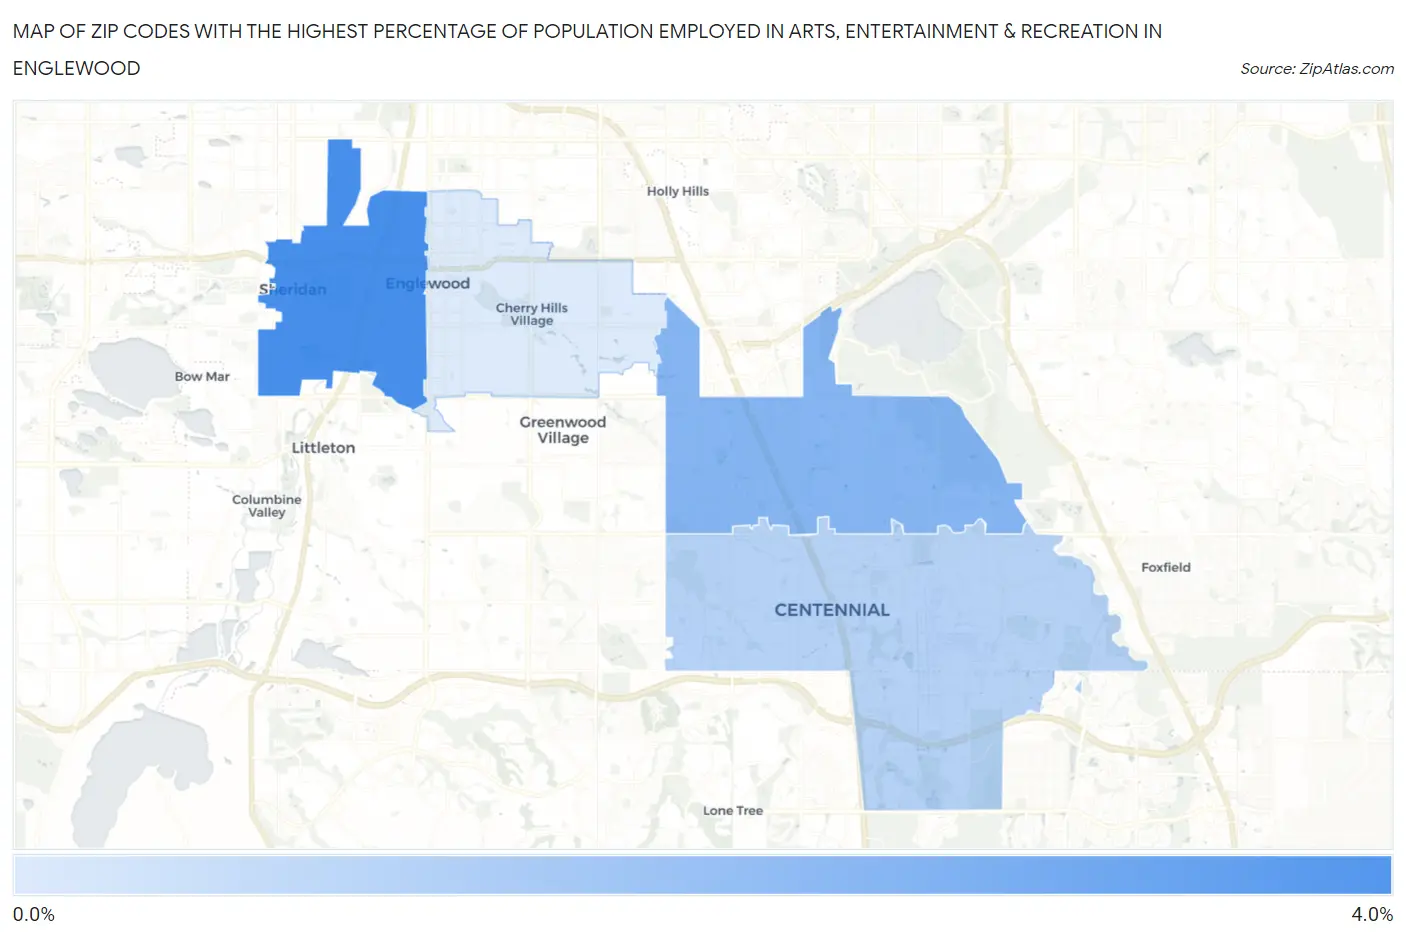
Map of Zip Codes with the Highest Percentage of Population Employed in Arts, Entertainment & Recreation in Englewood
0.94%
3.1%
Zip Codes with the Highest Percentage of Population Employed in Arts, Entertainment & Recreation in Englewood, CO
| Zip Code | % Employed | vs State | vs National | |
| 1. | 80110 | 3.1% | 2.6%(+0.565)#140 | 2.1%(+1.05)#4,968 |
| 2. | 80111 | 2.2% | 2.6%(-0.363)#216 | 2.1%(+0.126)#8,596 |
| 3. | 80112 | 1.5% | 2.6%(-1.04)#285 | 2.1%(-0.557)#13,062 |
| 4. | 80113 | 0.94% | 2.6%(-1.63)#326 | 2.1%(-1.14)#17,377 |
1
Common Questions
What are the Top 3 Zip Codes with the Highest Percentage of Population Employed in Arts, Entertainment & Recreation in Englewood, CO?
Top 3 Zip Codes with the Highest Percentage of Population Employed in Arts, Entertainment & Recreation in Englewood, CO are:
What zip code has the Highest Percentage of Population Employed in Arts, Entertainment & Recreation in Englewood, CO?
80110 has the Highest Percentage of Population Employed in Arts, Entertainment & Recreation in Englewood, CO with 3.1%.
What is the Percentage of Population Employed in Arts, Entertainment & Recreation in Englewood, CO?
Percentage of Population Employed in Arts, Entertainment & Recreation in Englewood is 2.4%.
What is the Percentage of Population Employed in Arts, Entertainment & Recreation in Colorado?
Percentage of Population Employed in Arts, Entertainment & Recreation in Colorado is 2.6%.
What is the Percentage of Population Employed in Arts, Entertainment & Recreation in the United States?
Percentage of Population Employed in Arts, Entertainment & Recreation in the United States is 2.1%.