Zip Codes with the Highest Percentage of Population Employed in Legal Services & Support in Englewood, CO
RELATED REPORTS & OPTIONS
Legal Services & Support
Englewood
Compare Zip Codes
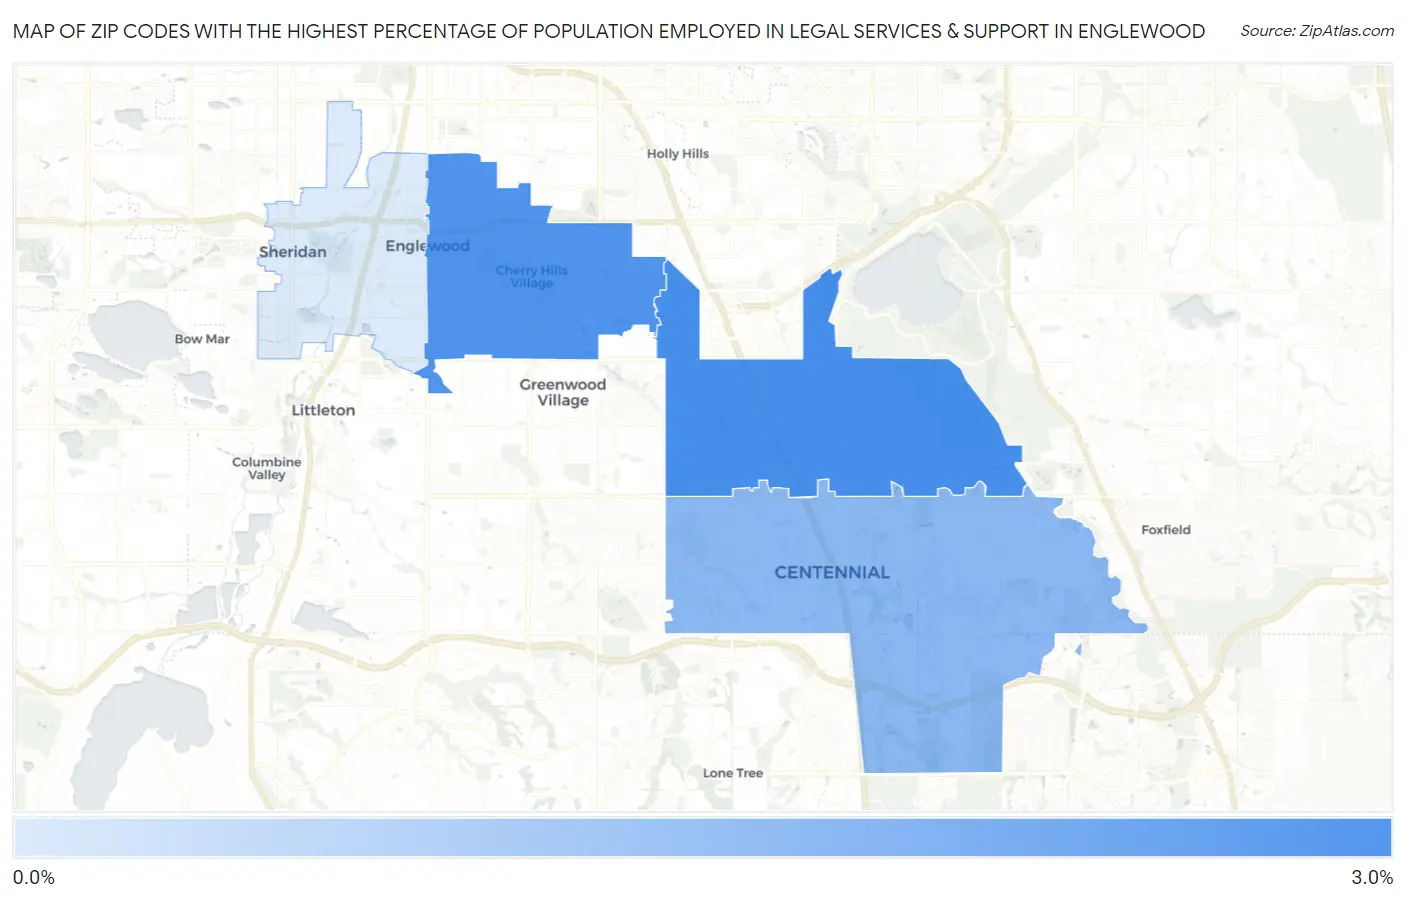
Map of Zip Codes with the Highest Percentage of Population Employed in Legal Services & Support in Englewood
0.76%
2.6%
Zip Codes with the Highest Percentage of Population Employed in Legal Services & Support in Englewood, CO
| Zip Code | % Employed | vs State | vs National | |
| 1. | 80111 | 2.6% | 1.2%(+1.42)#35 | 1.2%(+1.42)#2,343 |
| 2. | 80113 | 2.5% | 1.2%(+1.34)#39 | 1.2%(+1.34)#2,468 |
| 3. | 80112 | 1.8% | 1.2%(+0.600)#81 | 1.2%(+0.600)#4,045 |
| 4. | 80110 | 0.76% | 1.2%(-0.425)#195 | 1.2%(-0.425)#9,825 |
1
Common Questions
What are the Top 3 Zip Codes with the Highest Percentage of Population Employed in Legal Services & Support in Englewood, CO?
Top 3 Zip Codes with the Highest Percentage of Population Employed in Legal Services & Support in Englewood, CO are:
What zip code has the Highest Percentage of Population Employed in Legal Services & Support in Englewood, CO?
80111 has the Highest Percentage of Population Employed in Legal Services & Support in Englewood, CO with 2.6%.
What is the Percentage of Population Employed in Legal Services & Support in Englewood, CO?
Percentage of Population Employed in Legal Services & Support in Englewood is 1.4%.
What is the Percentage of Population Employed in Legal Services & Support in Colorado?
Percentage of Population Employed in Legal Services & Support in Colorado is 1.2%.
What is the Percentage of Population Employed in Legal Services & Support in the United States?
Percentage of Population Employed in Legal Services & Support in the United States is 1.2%.