Zip Codes with the Highest Percentage of Population with a Degree in Literature and Languages in Englewood, CO

RELATED REPORTS & OPTIONS

Literature and Languages
Population
Families and Households
Female Fertility
Female Fertility (Unmarried)
Race (Community Size)
Race (Percentage)
Ancestry (Community Size)
AfricanAlbanianAmericanApacheArabArgentineanArmenianAustralianAustrianBangladeshiBelgianBhutaneseBlackfeetBolivianBrazilianBritishBritish West IndianBulgarianBurmeseCanadianCelticCentral AmericanCentral American IndianCherokeeChileanChippewaChoctawColombianCosta RicanCreekCroatianCubanCzechCzechoslovakianDanishDominicanDutchEastern EuropeanEcuadorianEgyptianEnglishEthiopianEuropeanFilipinoFinnishFrenchFrench CanadianGermanGhanaianGreekGuatemalanHonduranHungarianIndian (Asian)IranianIrishIsraeliItalianJamaicanKoreanLaotianLatvianLebaneseLithuanianLuxembourgerMalaysianMalteseMexicanMexican American IndianMoroccanNavajoNicaraguanNigerianNorthern EuropeanNorwegianPakistaniPalestinianPanamanianPeruvianPolishPortuguesePuebloPuerto RicanRomanianRussianSalvadoranScandinavianScotch-IrishScottishSerbianSiouxSlavicSlovakSloveneSouth AfricanSouth AmericanSouth American IndianSpaniardSpanishSri LankanSubsaharan AfricanSwedishSwissThaiTonganTurkishUkrainianUteVenezuelanWelshWest IndianYugoslavian
Ancestry (Percentage)
AfricanAlbanianAmericanApacheArabArgentineanArmenianAustralianAustrianBangladeshiBelgianBhutaneseBlackfeetBolivianBrazilianBritishBritish West IndianBulgarianBurmeseCanadianCelticCentral AmericanCentral American IndianCherokeeChileanChippewaChoctawColombianCosta RicanCreekCroatianCubanCzechCzechoslovakianDanishDominicanDutchEastern EuropeanEcuadorianEgyptianEnglishEthiopianEuropeanFilipinoFinnishFrenchFrench CanadianGermanGhanaianGreekGuatemalanHonduranHungarianIndian (Asian)IranianIrishIsraeliItalianJamaicanKoreanLaotianLatvianLebaneseLithuanianLuxembourgerMalaysianMalteseMexicanMexican American IndianMoroccanNavajoNicaraguanNigerianNorthern EuropeanNorwegianPakistaniPalestinianPanamanianPeruvianPolishPortuguesePuebloPuerto RicanRomanianRussianSalvadoranScandinavianScotch-IrishScottishSerbianSiouxSlavicSlovakSloveneSouth AfricanSouth AmericanSouth American IndianSpaniardSpanishSri LankanSubsaharan AfricanSwedishSwissThaiTonganTurkishUkrainianUteVenezuelanWelshWest IndianYugoslavian
Immigrant Origin (Total)
Immigrant Origin (Percentage)
Income
Income (Families)
Income (Households)
Poverty
Poverty (Families)
Unemployment
Employment Occupations
Employment Industries
Employer Class
Commute Time
Commute Means
School Enrollment
Education by Degree Field
Occupancy
Finances
Physical Characteristics
Englewood
Compare Zip Codes
Comparison Subject

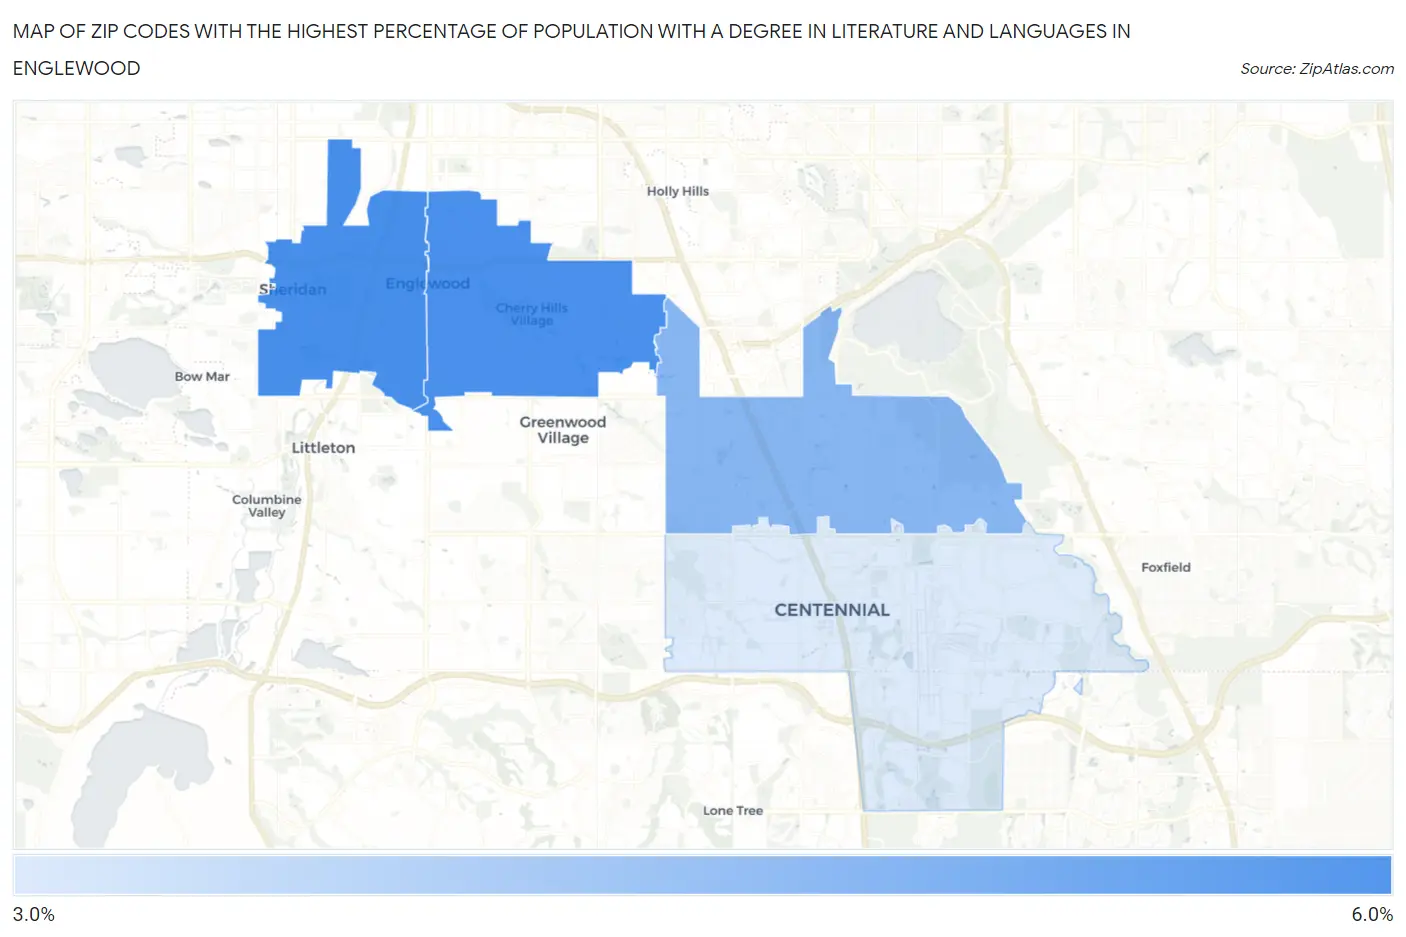
Map of Zip Codes with the Highest Percentage of Population with a Degree in Literature and Languages in Englewood

0.0%
6.0%
Zip Codes with the Highest Percentage of Population with a Degree in Literature and Languages in Englewood Map

Zip Codes with the Highest Percentage of Population with a Degree in Literature and Languages in Englewood, CO

Zip Code % Graduates vs State vs National
1.801106.0%4.6%(+1.34)#954.4%(+1.55)#5,478
2.801135.9%4.6%(+1.30)#984.4%(+1.51)#5,567
3.801115.0%4.6%(+0.369)#1434.4%(+0.583)#7,380
4.801123.7%4.6%(-0.937)#2214.4%(-0.723)#11,209

Common Questions

What are the Top 3 Zip Codes with the Highest Percentage of Population with a Degree in Literature and Languages in Englewood, CO?
Top 3 Zip Codes with the Highest Percentage of Population with a Degree in Literature and Languages in Englewood, CO are:
#1
6.0%
#2
5.9%
#3
5.0%
What zip code has the Highest Percentage of Population with a Degree in Literature and Languages in Englewood, CO?
80110 has the Highest Percentage of Population with a Degree in Literature and Languages in Englewood, CO with 6.0%.
What is the Percentage of Population with a Degree in Literature and Languages in Englewood, CO?
Percentage of Population with a Degree in Literature and Languages in Englewood is 5.9%.
What is the Percentage of Population with a Degree in Literature and Languages in Colorado?
Percentage of Population with a Degree in Literature and Languages in Colorado is 4.6%.
What is the Percentage of Population with a Degree in Literature and Languages in the United States?
Percentage of Population with a Degree in Literature and Languages in the United States is 4.4%.